
Click
on the image to see full-size! |
After the BLAST search has been submitted,
the screen shown in the graphic to the left should appear. Click on the  button to open a new browser window that contains the BLAST results.
 |
|
Click
on the image to see full-size! |
The top of the results of BLAST page
should resemble the thumbnail to the left. Scrolling through the BLAST
results, you will see that the top of the BLAST output page includes:
-
a unique request ID (RID)
-
information on the databases which were searched
-
a link to taxonomy reports
-
query information
Click on the link for "Taxonomy Reports" |
|
Click
on the image to see full-size! |
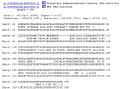
Clicking on Taxonomy reports just
above the Graphical Display will open a new browser window that displays
BLAST results in three different views:
-
Lineage Report. Displays hits by species with the species grouped
to show taxonomic relationships
-
Organism Report. Organism Report groups all hits by organism.
-
Taxonomy Report. Shows the number of hits and the number of organisms
within each taxon.
Note:
Taxon (taxa pl.) is a non-specific term for a taxonomic group. Thus it
could be used to refer to class, order, family, genus, species, etc.
In this example, the Lineage Report shows 151 H. sapiens records with a
sequence which is similar to the query sequence. Of our closest taxonomic
relatives, there are 5 hits each for gorillas and chimpanzees and 8 hits
for bonobo chimps. There are 26 hits for a more distant relative, the Norway
Rat. There is also 1 hit for a very distant relative, the Duck-Billed Platypus.
For more information about BLAST
taxonomy reports, see Taxonomy
BLAST Help.
|
|
The graphical overview
displays the best sequence alignments for the search.
-
The top bar, shown in the screenshot below, shows the color key for alignment
scores. These scores are statistically derived values that reflect the
degree of similarity between hit and query sequences. The higher the score,
the more similar the two.
-
Immediately below the color key, the query sequence is represented by a
red bar; the numbers refer to amino acid position.
|
|
Click
on the image to see full-size! |
Database hits are shown aligned to
the query, below the red bar.
-
The score of each alignment is indicated according to the color key. Of
the aligned sequences, the most similar are shown closest to the query.
-
The thin parts of some bars indicate that there are two regions of similarity
on the same protein, but that the intervening region does not match.
NOTE:
The two regions of similarity may not match equally well, as shown by the
gold arrow.
-
Mousing over a hit sequence displays the definition line for the sequence,
and the alignment score, in the window at the top.
-
Clicking on a hit sequence links to the full pairwise alignment between
hit and query sequence alignments, which is displayed farther down in the
output page.
|
|
Click
on the image to see full-size! |
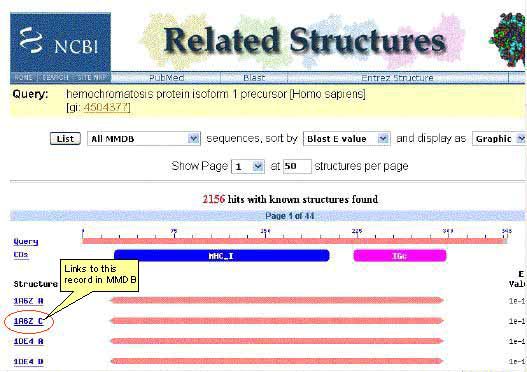
Below the graphical display are the
FASTA descriptions of all 509 hits. The most significant alignments
are at the top. The first ten descriptions are shown in the screenshot
to the left. The number of descriptions and other features included on
the BLAST results page can be adjusted in the Format box of the BLAST
page.
Each Sequence Description has the following Features:
-
This portion of each description links to the GenBank
record for a particular hit.
-
The bit score is calculated from the
number of differences (gaps and substitutions) between each sequence and
the query sequence. The higher the score, the more significant the alignment.
Each score links to the corresponding pairwise alignment (see the next
section).
-
The E Value (Expect Value) describes
the likelihood that a sequence with a similar score will occur in the database
by chance. The smaller the E Value, the more significant the alignment.
For example, the first alignment has a very low E value of 2e-175 (the
probability that this bit sore would have occurred by chance is 2e-175
or
1 in 1078 ). Since the number of sequences in GenBank is only
approximately 5.5 x 10⁷, the probability of a a match by chance
is infinitesimal.
-
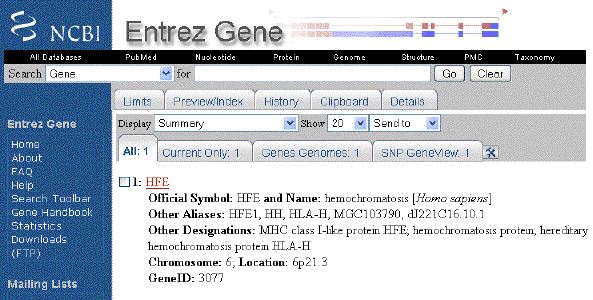
The
 icon links
to the Entrez Gene database record for the
sequence. The icon links
to the Entrez Gene database record for the
sequence. The  icon links to the Related Structures for
the sequence.
icon links to the Related Structures for
the sequence.
|
|
Click
on the image to see full-size! |
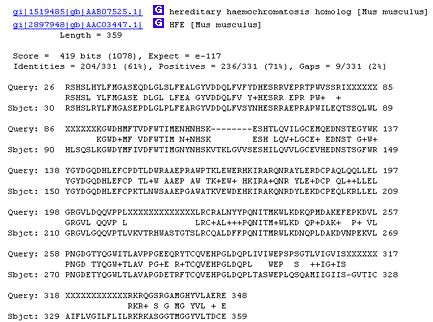
Below the descriptions are pairwise
alignments that show the entire length of each hit sequence matched with
the entire query sequence.
-
Accession Numbers and descriptions of the hit sequence are given at the
top.
-
Statistics on the alignment are given in the lines below the description.
-
The hit sequence is presented in the Sbjct: line, and the query
sequence in the Query: line. The numbers refer to the amino acids
in each sequence. In the example to the left, amino acids 26-348 of the
query sequence align with amino acids 30-359 of the hit sequence.
-
The amino acids are identified using 1-letter
abbreviations. In the example to the left, amino acids 30-34 of the
hit sequence are: arginine-serine-histidine-serine-leucine
-
Each between the Subject and Query lines indicates that the amino acids
at that position in both sequences are identical. In the example to the
left, amino acids 26-30 in the query sequence are aligned with amino acids
30-34 of the hit sequence.
-
Each blank space between the Subject and Query lines means that amino acids
at the specified position in both sequences do not match. For example,
amino acid 31 in the query sequence is histidine, which does not
match arginine in the hit sequence.
-
Dashes inserted into either query or subject sequence indicate gaps introduced
to compensate for insertions and deletions.
-
Low complexity sequences may create a false
alignment between two unrelated sequences. Automatic filtering replaces
low-complexity repeats with a string of X's (not one of the symbols
which represent an amino acid) to eliminate artefactual hits. In nucleotide
sequences, N's replace low-complexity regions rather than X's.
|