DeepView - Swiss-PdbViewer
is an application that provides a user friendly interface allowing to analyze
several proteins at the same time. The proteins can be superimposed in order to
deduce structural alignments and compare their active sites or any other
relevant parts. Amino acid mutations, H-bonds, angles and distances between
atoms are easy to obtain thanks to the intuitive graphic and menu interface.
A detailed tutorial for the basic manipulation of Swiss-PdbViewer has been
prepared by Prof. Gale Rhodes from the University of Southern Maine Portland.
http://www.usm.maine.edu/~rhodes/SPVTut/index.html
 |
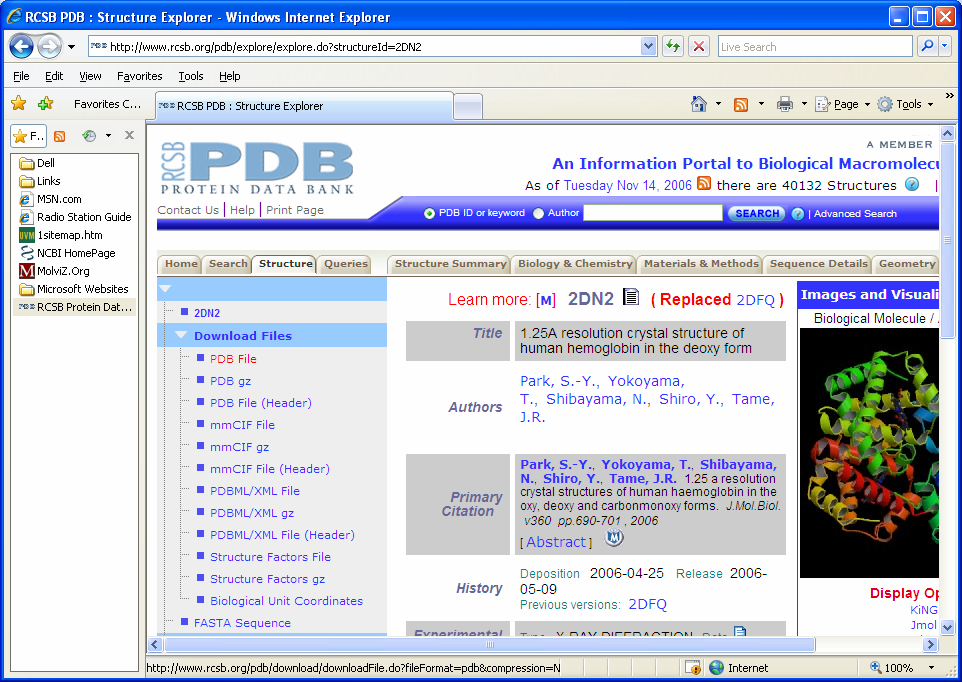
In order to use Swiss-PdbViewer the PDB file for our protein of interest must
be identified. For this tutorial we will be looking at the human hemoglobin
molecule. We know from the previous tutorial that the PDB ID number for human
beta globin is 2DN2. Go to the PDB web site at
http://www.rcsb.org/pdb/home/home.do Do a search for 2DN2. This
will open the PDB record. Under the left menu click on download files. Select "PDB
file" Save this file to the desk top!!!
This file contains all the coordinates of all the atoms in the structure |
|
Click on the
image to see full-size! |
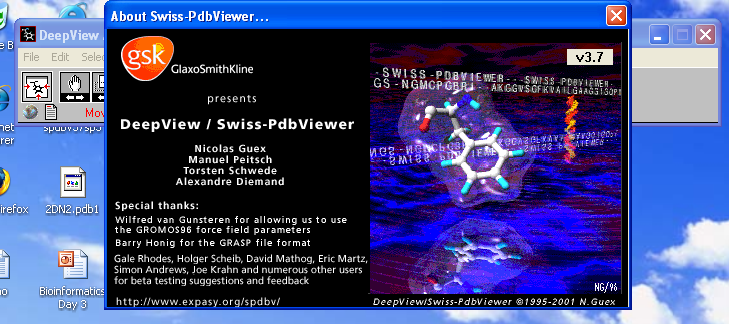
Open Swiss-PdbViewer using the "Shortcut
to spdv" icon on your desktop.
Close the "About Swiss-PdbViewer window" to clearly view the tool bar. |
|
Click on the
image to see full-size! |
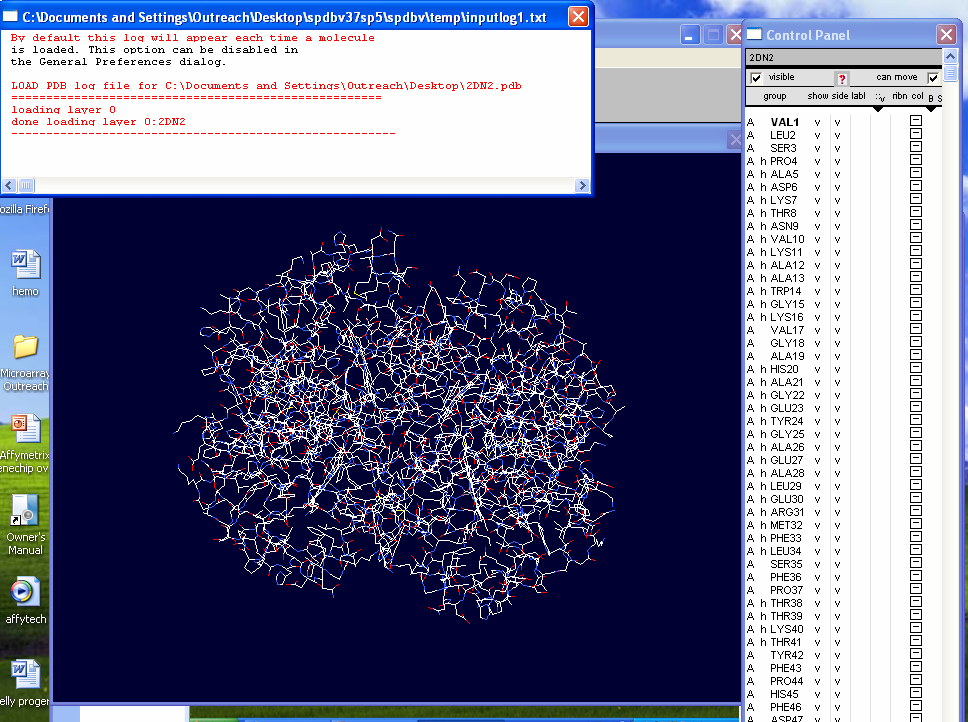
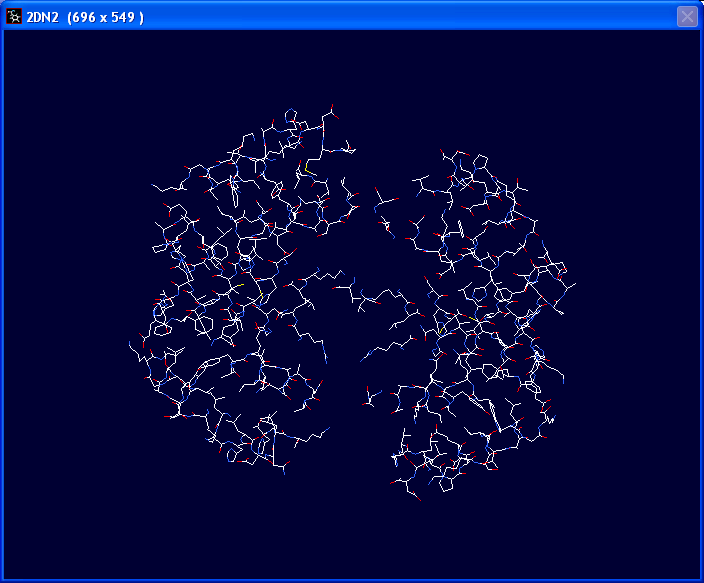
Using the "File" drop down menu open the
2DN2 PDB file previously saved on the desktop.
Close the small window "By default this log...." in front of the tool bar.
If the "Control Panel" window does not open to the right of the structure
image, open it under the "Window" drop down menu. |
|
Click on the
image to see full-size! |
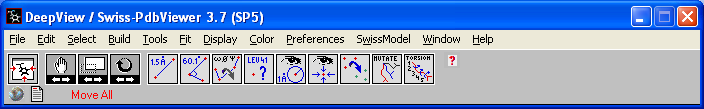
The tool bar has the pull down menus and below that several tool
buttons. The first 4 buttons are used to move your image. 1-centers
and resizes the whole image in the window 2-translates
the image across the screen
3-shrinks and enlarges the image
4-rotates the image Play with each of these
buttons to get used to the movements. |
|
Click on the
image to see full-size! |
The next 9 gray buttons allow you to
examine and manipulate the structure. The first 3 allow you to measure distances
(1.5A), angles and dihedral angles respectively. The
4th tool
(Leu41 ?) is the identity tool that allows you to label individual atoms and
amino acids in the structure.
5 -allows you to display molecules within a certain radius of an atom.
6 -centers the molecule around one atom.
7 -used for comparing two molecules
8 -mutation tool
9 -torsion tool that evaluates the fit of a molecule |
|
Click on the
image to see full-size! |
From the "Display" pull down menu
choose Slab. This gives you a cross-section of the molecule with a
certain depth. The depth can be increased or decrease by holding down
the shift + left mouse button.
The molecule can be rotated through the slab by holding down the
left mouse button.
Holding down the right mouse button translates the slab.
Play with these to get used to manipulating the
slab. |
|

|
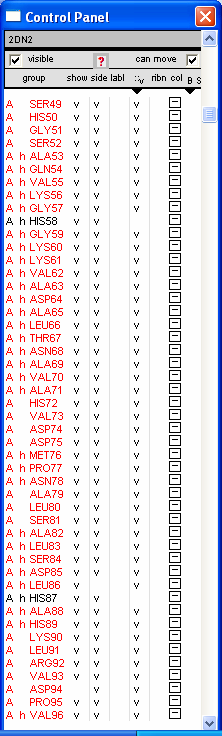
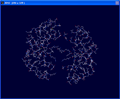
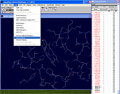
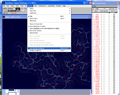
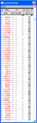
We will now focus on the A chain of human
hemoglobin. In the "Control Panel" scroll down to the button of the where you
will see the listed the 4 heme molecules associated with the 4 different
hemoglobin chains (A ,B ,C and D).
Click on the D next to HEM147. This will select all atoms associated with the
D chain (see the thumbnail). Hold down Shift + Ctrl while Left
clicking "show" at the top of the control panel will delete the D
chain.
Do the same for the B and C chains.
Only the A chain structure should be remaining.
(Selecting a deleted chain and holding Shift while left clicking
will "show" will return the chain into view.) |
|
|
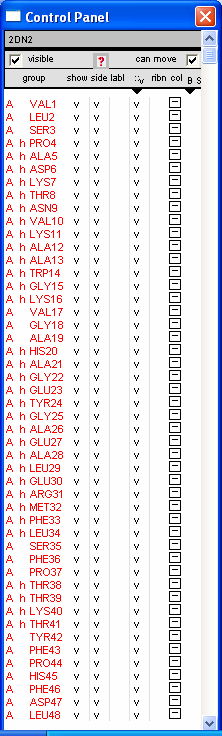
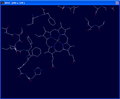
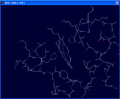
We now want to focus on the heme group in
the A chain. At the bottom of the Control Panel right click on HEM142
of the A chain.
This will center the molecule on the heme group. |
|
Click on the
image to see full-size! |
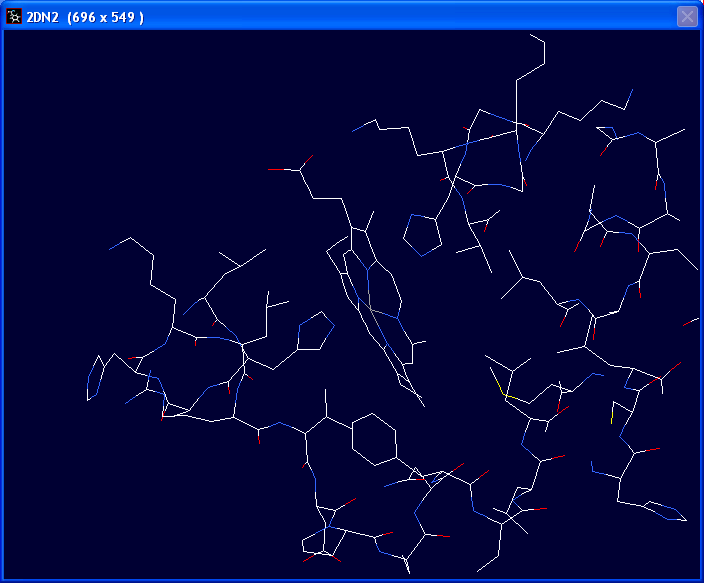
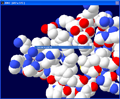
Rotate the molecule and adjust the
slab thickness to view the porphyrin ring of the heme and the
two histidine groups associated with either side of the ring.
|
|
 |
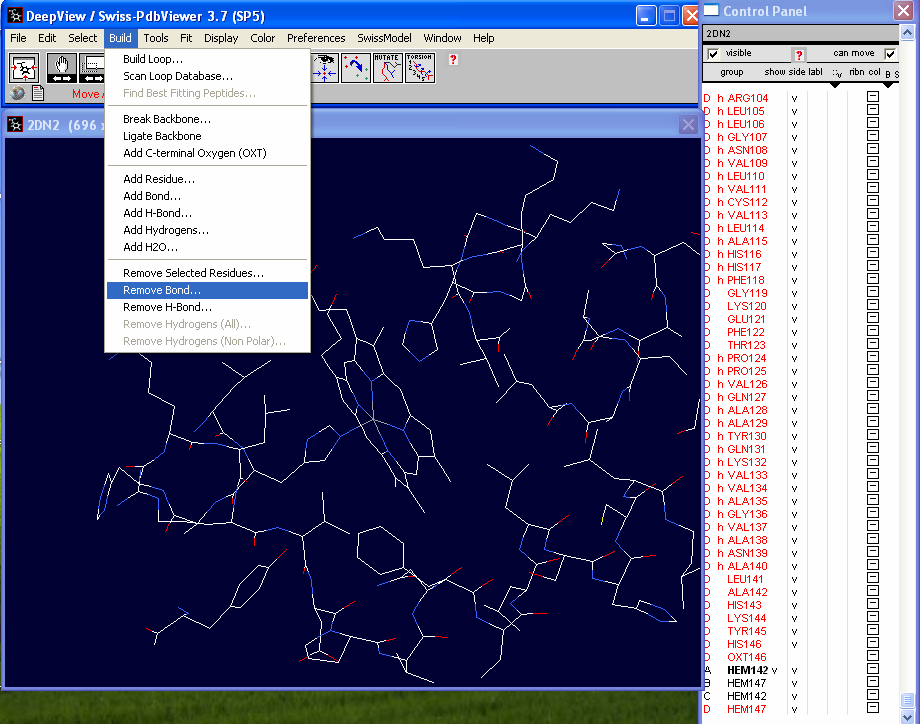
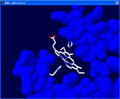
There is a bond between a nitrogen atom of one of the histidine groups and
the Fe+ atom in the center of the porphyrin ring . This bond needs to
be deleted (these atoms are not covalently linked). In the "Build" drop
down menu choose "Remove Bond" |
|
|
In the tool bar you will see "Pick 1st
atom" in red. Click on the Fe+ atom in the center of the
heme group. You will then see "Pick 2nd atom" in the tool bar. Click on the
nitrogen atom in the histidine.
The bond should disappear as in the thumbnail to the left. |
|
Click on the
image to see full-size! |
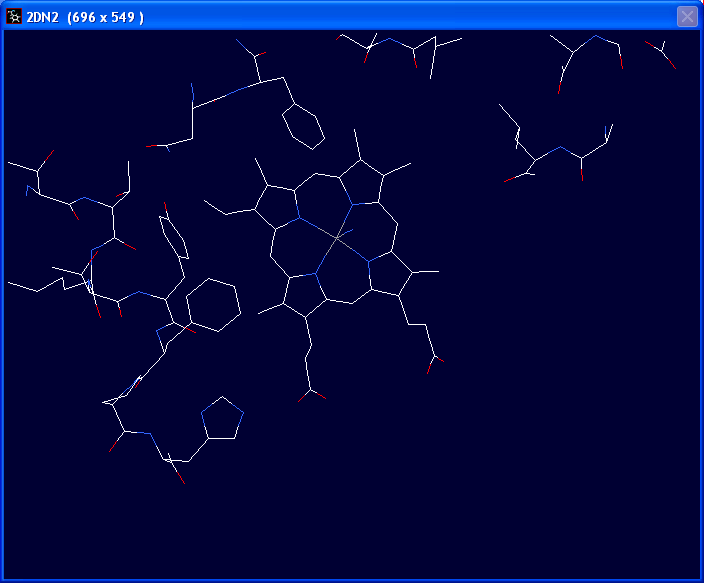
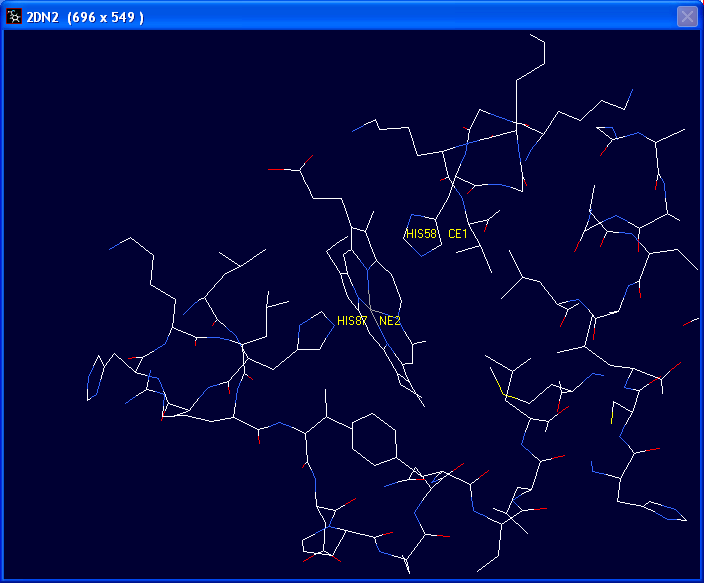
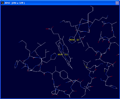
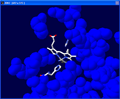
Next we will determine which histidine
residues are associated with the heme group by labeling them.
Choose the Leu41 ? identity tool. Click on the two histidine
groups closest to the heme group. This should identify the two groups as His58
and His 87.
Click on Leu41 ? to turn it off.
To remove labels go to the "Display" drop down menu and click on "Label
Kind" then "Clear User Labels". |
|
Click on the
image to see full-size! |
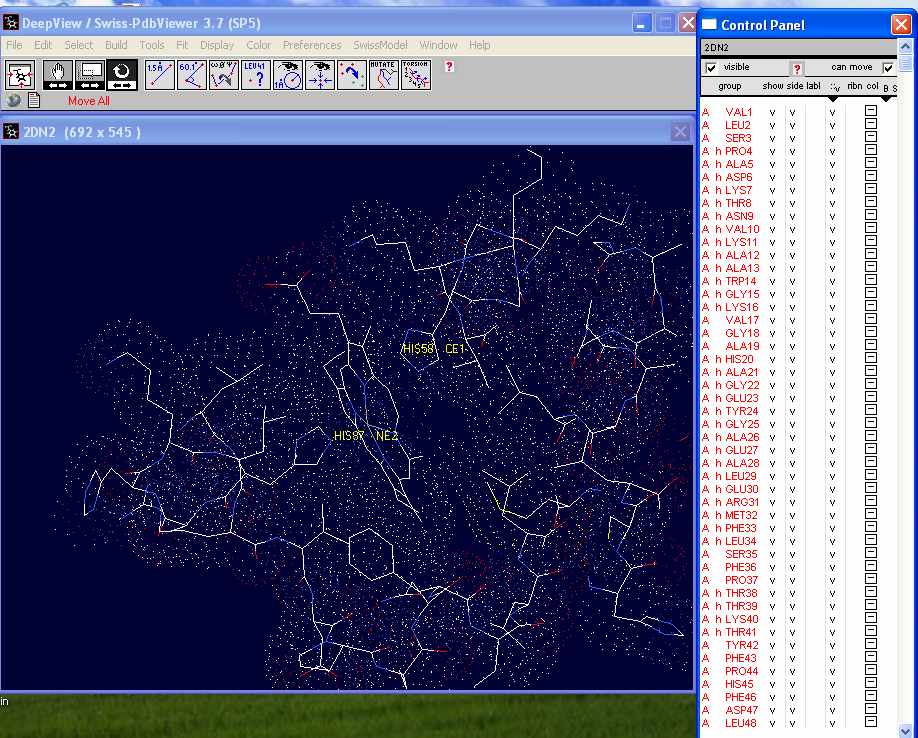
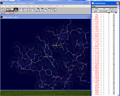
In the "Control Panel" select the A chain
then Shift + left click on the :v column. Van der Waals Radii
should appear around each atom.
|
|
Click on the
image to see full-size! |
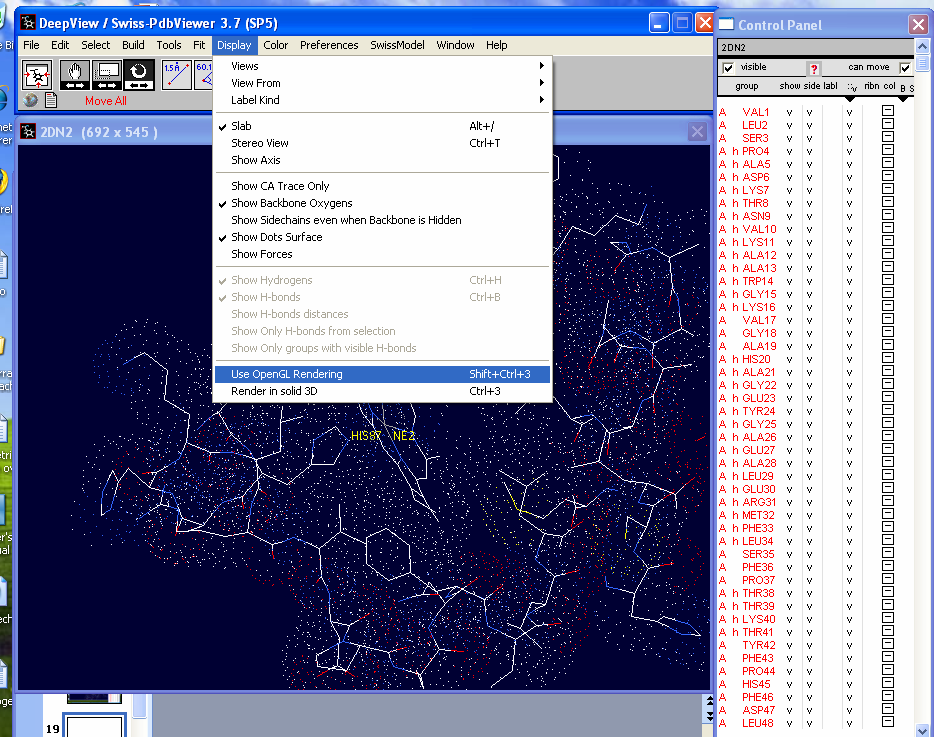
To make the display solid under the "Display"
menu choose "Use OpenGL Rendering" followed by choosing "Render in
solid 3D". |
|
Click on the
image to see full-size! |
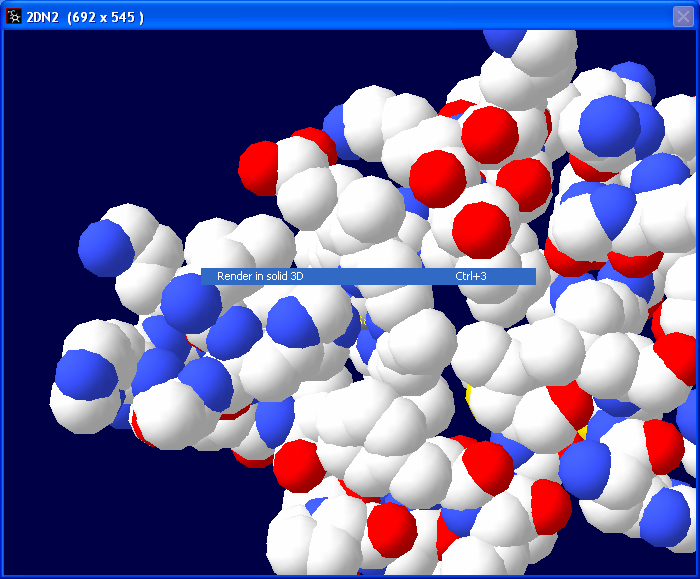
The image should now be solid and colored
with the CPK color scheme.
|
|
Click on the
image to see full-size! |
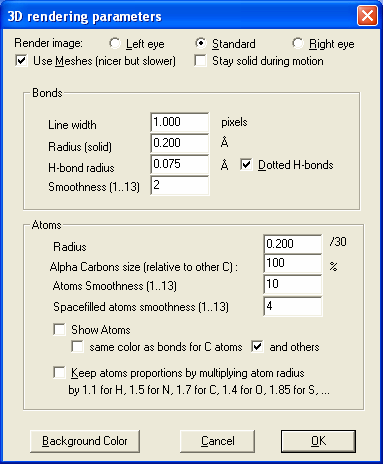
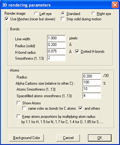
Next in the "Preferences" menu
choose "3D Rendering" set Atoms Smoothness to 10. To give a
bit more space between the space filled atoms. |
|
Click on the
image to see full-size! |
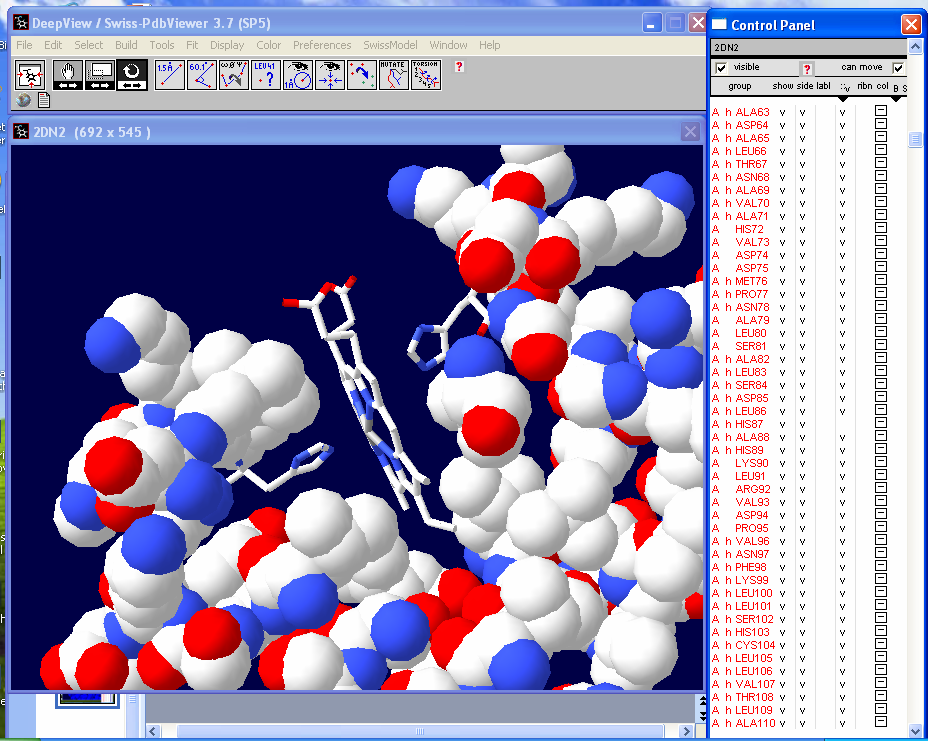
Next click on the v in the :v
column for HIS58, HIS87 and HEM142. This will return these
back to ball and stick mode.
|
|
Click on the
image to see full-size! |
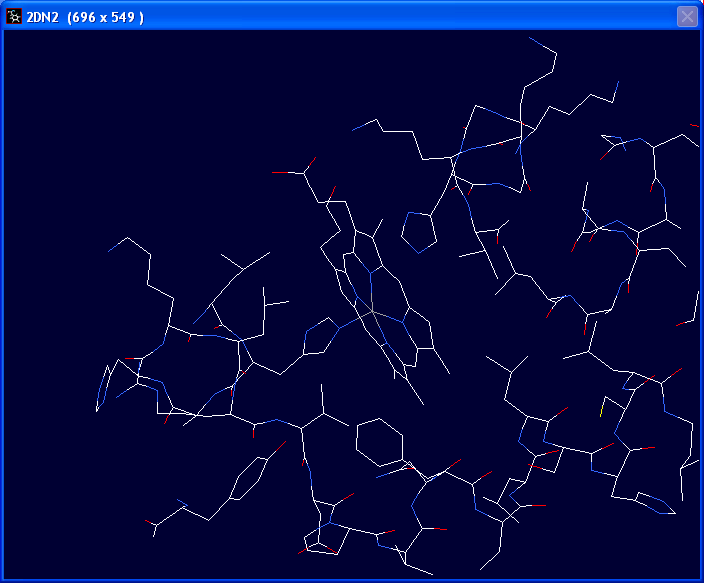
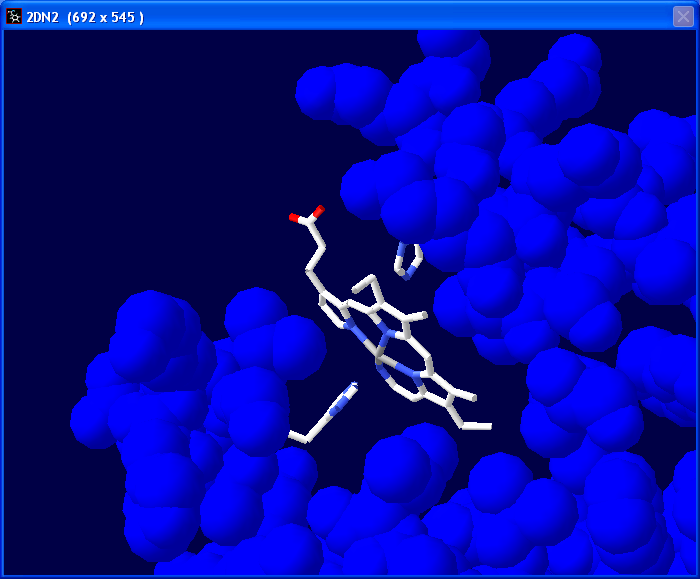
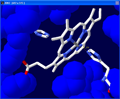
Now we are going to change the color of
all the atoms except those associated with the heme group and the two
interacting histidines (HIS58 and HIS87). First select Chain A in the "Control
Panel" then go in and deselect HIS58, HIS87 and
HEM142 with Ctrl + left click. |
|
Click on the
image to see full-size! |
Select "col" in the "Control
Panel" and pick a color. Here we chose a blue color. |
|
Click on the
image to see full-size! |
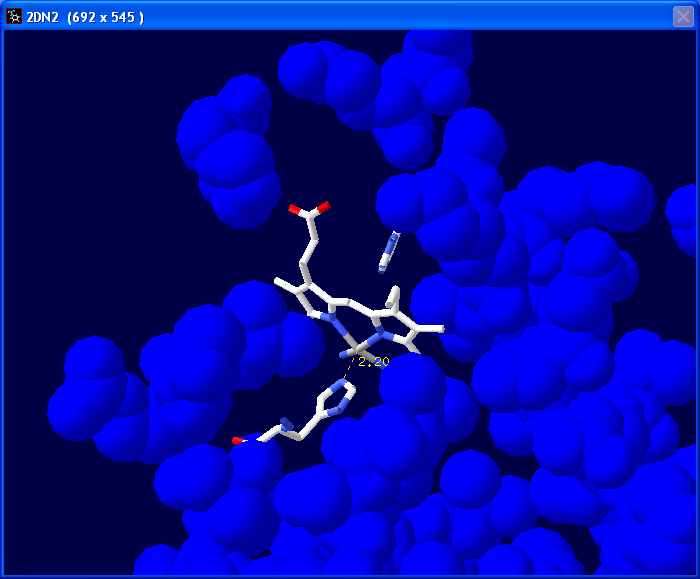
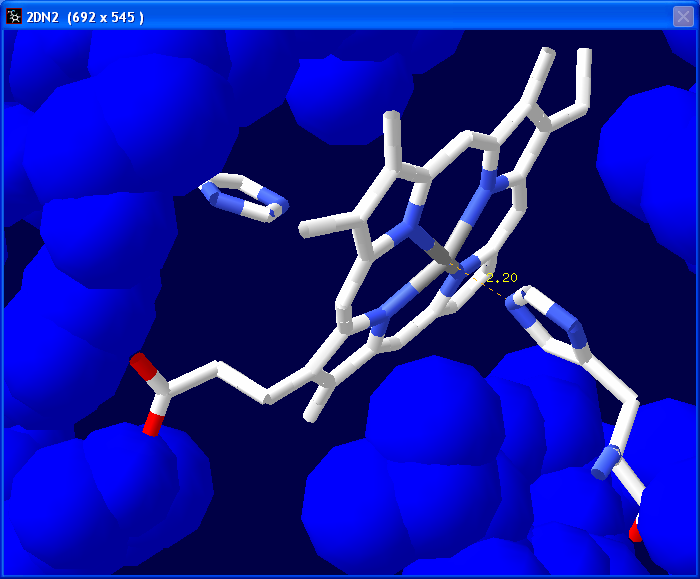
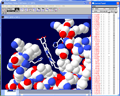
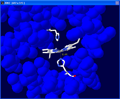
Next we are going to measure the
distance between the nitrogen atom in His87 that is closest to
the Fe+ in the heme group (We are basically
measuring the bond that we previously deleted). Select the 1.5A
tool.
In the tool bar you will see "Pick 1st atom" in red. Click on the Fe+
atom in the center of the heme group.
You will then see "Pick 2nd atom" in the tool bar. Click on the nitrogen
atom in the histidine.
A line will appear with the measured distance in Angstroms.
|
|
Click on the
image to see full-size! |
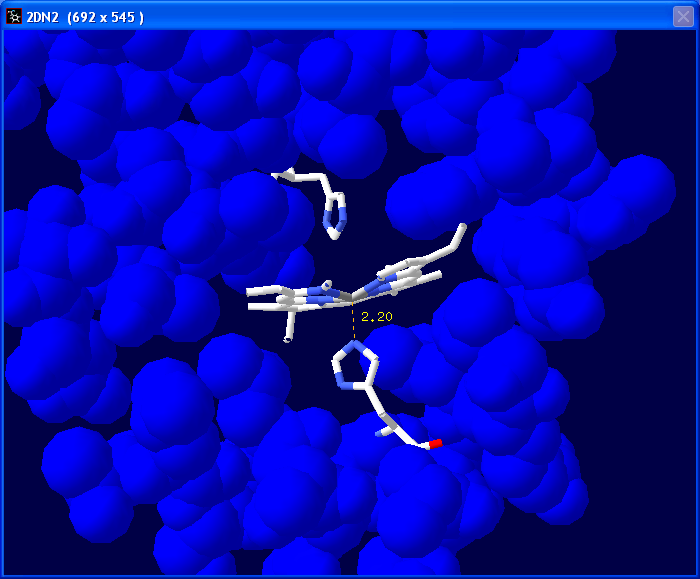
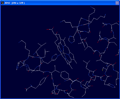
Manipulate the image to get a good view of
the molecule to save as a screen shot. Some examples are on the left. To save
the screen shot hold down Alt and press the Prnt Scrn button on
your keyboard. Paste this image into a PowerPoint document/slide. |