
This page is a quick response to a question on post-hoc approaches to repeated measures. Elsewhere I have created a page on this issue, focusing mainly on designs where the repeated variable is categorical rather than ordinal. Here I want to look at the case where the independent variable is ordinal. To do this I need a set of data, and a table showing the data can be found in the section on polynomial trend in Chapter 14. Look at pages 20 - 43. I didn't need to stick in the whole chapter, but I was in a hurry. (Don't worry about what is in yellow--that had something to do with copy editing.)The raw data, in ASCII form, are available at http://www.uvm.edu/~dhowell/methods/DataFiles/Tab14-4.dat
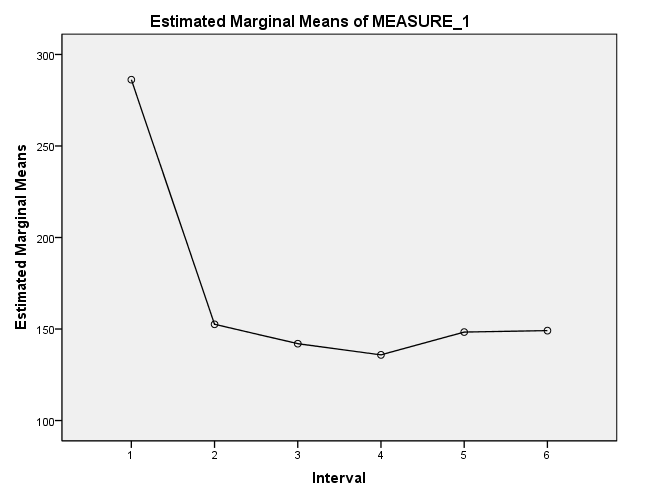
In this example we have both a repeated measure (Interval) and a between-subject measure (Group). At first I will completely ignore the grouping variable. I chose these data simply because I had them on hand, not for any other purpose. The summary table is shown below, and you can ignore the effect for Between subjects and the interaction. The graph of Interval is follows. Here you can see that the line drops after Interval One and then pretty much levels off. It is hard to believe that it then rises, or that it rises and then falls, but we'll come to that.
We can ask SPSS to fit a quadratic function to these data. We do this on the dialog box that includes the Contrast button. 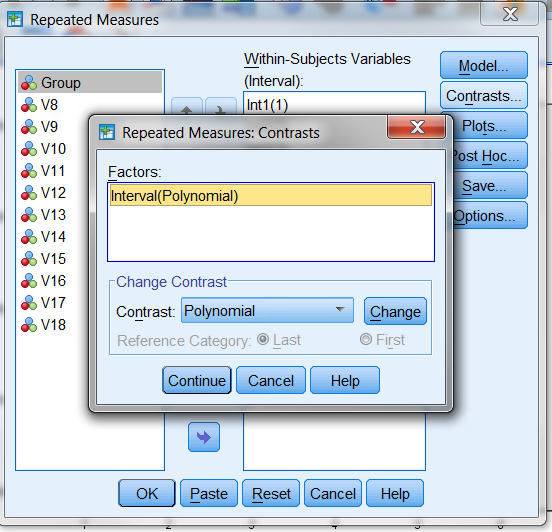 Be careful, because just clicking on Contrast Polynomial won't do it. You have to hit the Change button. (I make that error all the time.)
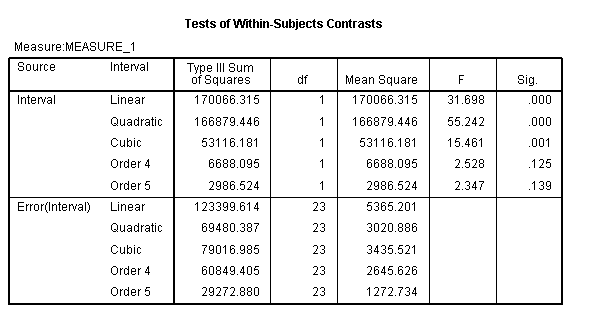
You will obtain the following output. Notice that the linear trend is significant, simply telling you that the curve drops off as it moves from Interval 1 to Interval 6. You will also see a significant quadratic component because the curve levels off. I have no idea why you are finding a significant cubic component--whatever it is, it is too subtle to be worth pursuing.
If I wanted to give an example with a between subject effect, I could do the same analysis except that I would include Group as a between subject factor. Then the analysis will show that you have a significant linear trend on the interaction. That means that whatever linear trend over Interval that you find in Group 1 is different from the linear trend you find in Group 2. If you really wanted to pursue this, I would suggest using the Split File command for Groups, giving you separate analyses for each group.
dch: