JMP Tutorial:
Excluding Data From an Analysis
Click the link below and save the following JMP file to your Desktop:
Now go to your Desktop and double click on the JMP file you just downloaded.
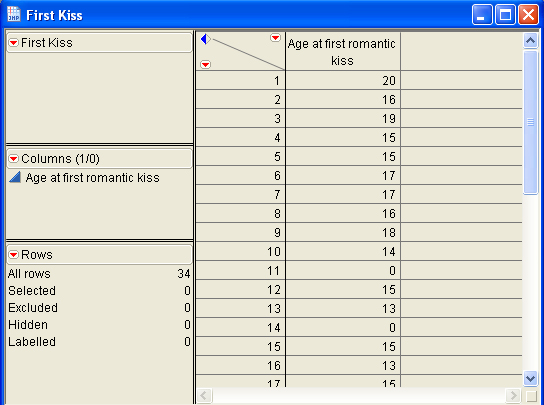
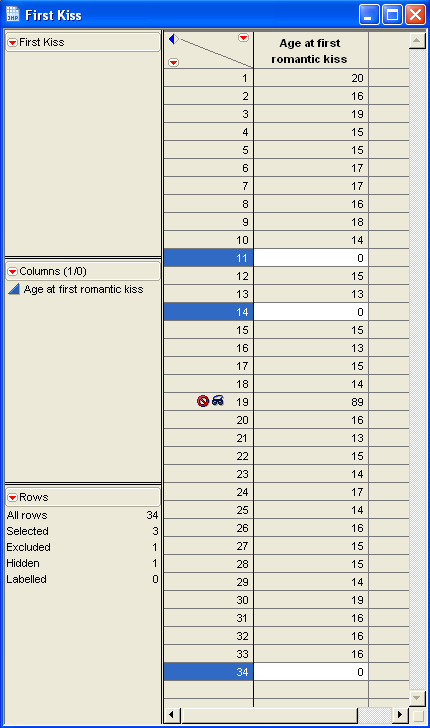
This action will start JMP and display the content of this file:
Thirty-four college sophomores were asked in an online survey: "At what age did you have your first romantic kiss?" They were asked to enter "zero" if it had not happened yet. The data file First Kiss contains the results.
Click the Analyze menu, then select Distribution.
Click on the column Age at first romantic kiss and click Y, Columns.
Click OK.
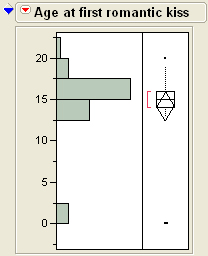
You should see:
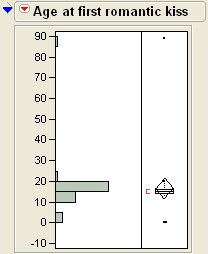
Someone answered 89, and this person was obviously joking around. Let's eliminate this point from any future analysis.
Position your cursor on the dot in the box ploy for that point. You
should see a "19" appear, indicating this is observation 19.
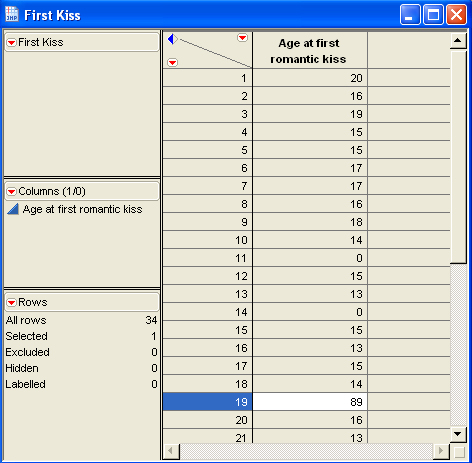
Click once on this point.
Click on the Window menu, then pull to First Kiss to return to the
data set.
You should see that row 19 is now highlighted.
Click the Rows menu and select Exclude/Unexclude.
Click again on the Rows menu and select Hide/Unhide.
Notice the additional graphics now present on row 19.
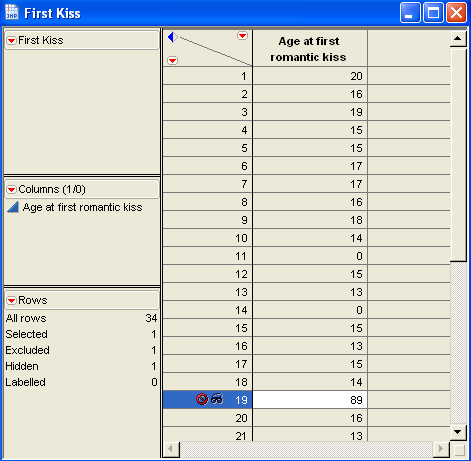
The circle with a line through it means this observation will not be included in any future calculations (i.e., it is "Excluded").
The "goggles" means that this observation will not be displayed in any future graphics produced (i.e., it is "Hidden").
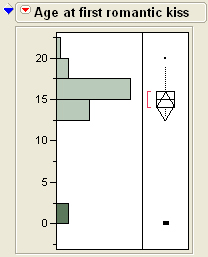
Let's re-generate our histogram: (Analyze, Distribution, etc.).
You should see:
We should have eliminated the "zeros" from our analysis as well.
Click on the bar in the histogram next to the zero on the age axis. The bar
is now highlighted:
and, the 3 rows that contain "zero" are also highlighted:
Following
the instructions above, exclude and hide these observations as well.
Re-generate the histogram.
You should see:
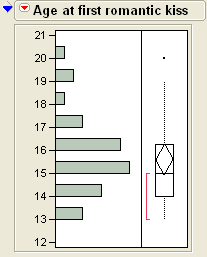
Note: You could have deleted the rows in question, but its better to use the above approach, in case you decide later you want to unexclude and unhide certain observations.