Click the link below and save the following JMP file to your Desktop:
Now go to your Desktop and double click on the JMP file you just downloaded.
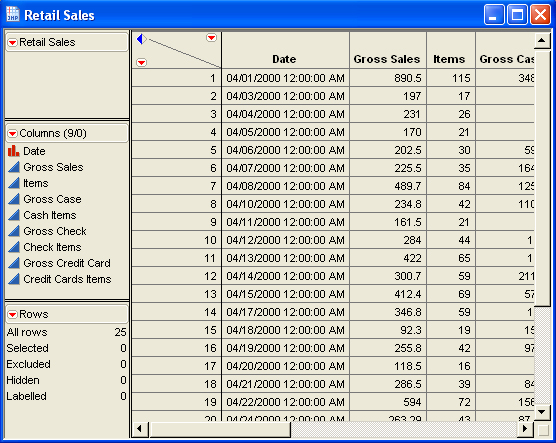
This action will start JMP and display the content of this file:
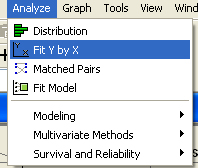
Go to the Analyze menu and select Fit Y by X:
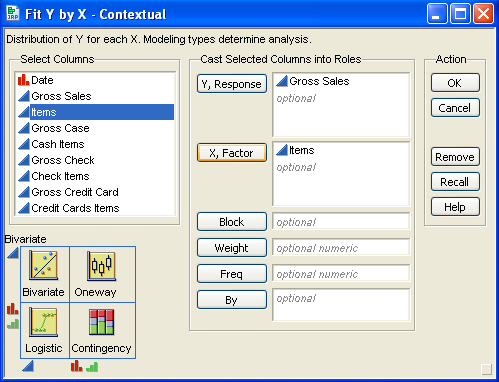
Click the column Gross Sales, then click Y, Response.
Click the column Items, then click X, Factor.
Your screen should now look similar to the following:
Click OK.
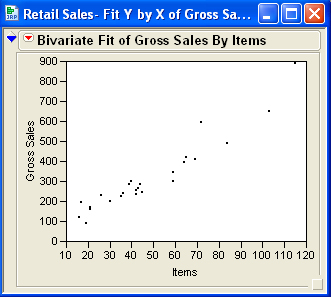
The scatter plot is produced:
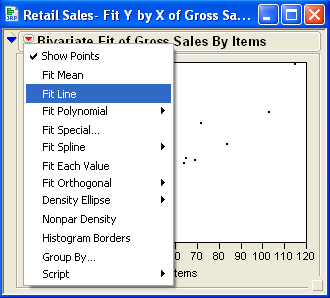
Click on the red down arrow next to Bivariate Fit of Gross Sales By Items and select Fit Line:
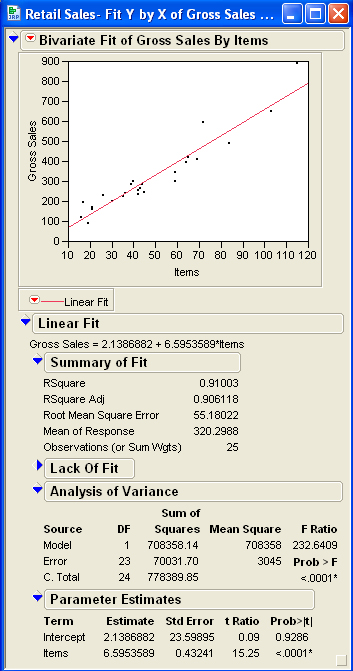
You should see:
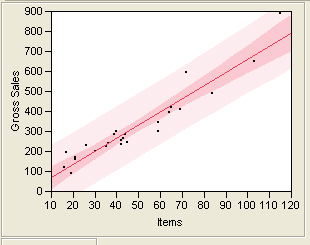
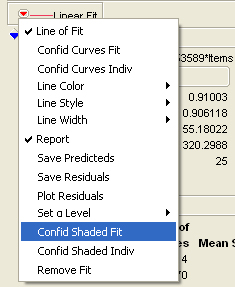
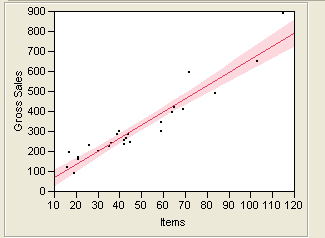
Click the red down arrow next to Linear Fit and pull to Confid Shaded Fit:
You should now see, on the scatter plot, the 95% confidence interval for the mean value of y for a given value of x for all values of x.
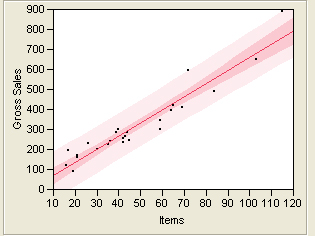
Click again on the red down arrow next to Linear Fit and pull to Confid Shaded Indiv:
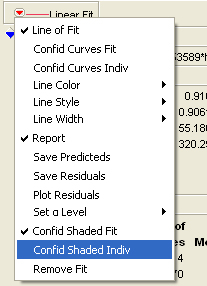
You should now also see, on the scatter plot, the 95% prediction interval for a single value of y for a given value of x for all values of x. Notice these bands are wider than the confidence interval bands:
If you wish to display 99% confidence and prediction intervals rather than 95%, click the red down arrow next to Linear Fit, go to Set α Level, then 0.01.
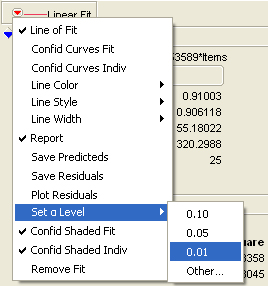
You should see both sets of bands get wider: