An introduction to Matplotlib

A brief introduction to plotting with Matplotlib
Now that we’ve seen how to read data from a file, and how to generate some descriptive statistics for the data, it makes sense that we should address visual presentation of data. For this we will use a third-party1 module: Matplotlib.
Matplotlib is a feature-rich module for producing a wide array of graphs, plots, charts, images, and animations. It is the de facto standard for visual presentation of data in Python (yes, there are some other tools, but they’re not nearly as widely used).
Since Matplotlib is not part of the Python core library (like the math, csv, and statistics modules we’ve seen so far), we need to install Matplotlib before we can use it.
The installation process for third-party Python modules is unlike installing an app on your phone or desktop. Some IDEs (PyCharm, Thonny, VS Code, etc.) have built-in facilities for installing such modules. IDLE (the Python-supplied IDE) does not have such a facility. Accordingly, we won’t get into the details of installation here (since details will vary from OS to OS, machine to machine), though if you’re the DIY type and aren’t using PyCharm, Thonny, or VS Code, you may find Appendix C: pip and venv helpful.
Here are some examples of plots made with Matplotlib (from the Matplotlib gallery at matplotlib.org):
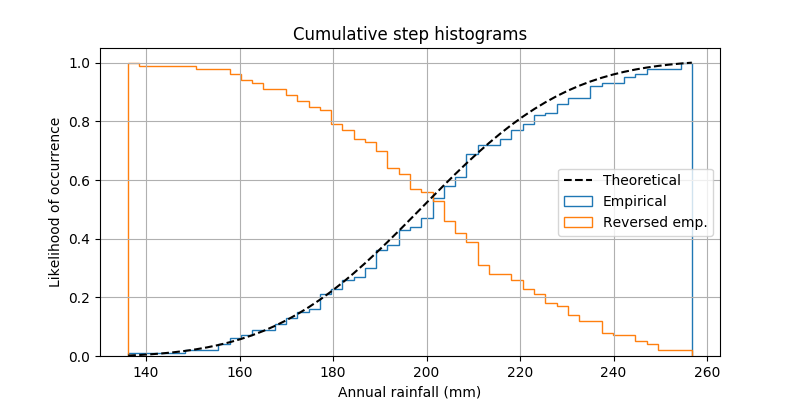
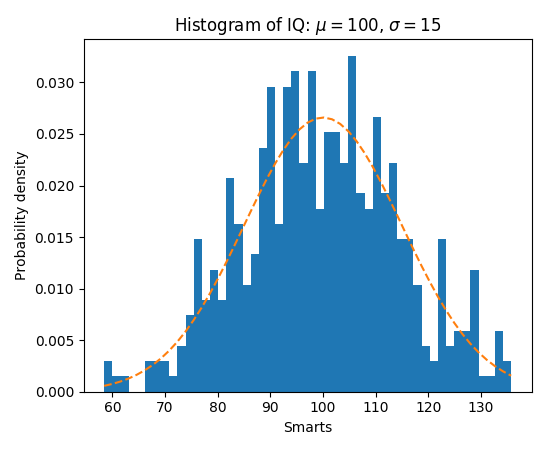
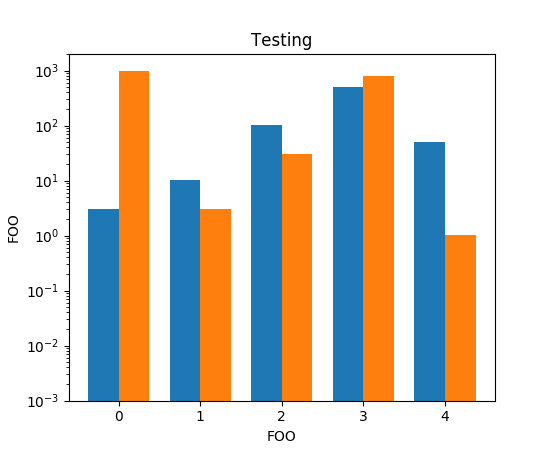
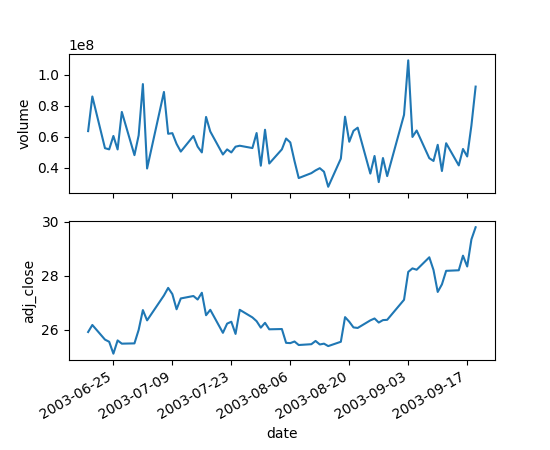
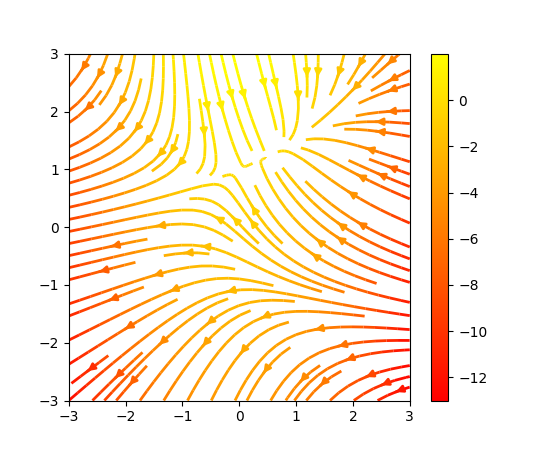
For more examples and complete (very well-written) documentation, visit https://matplotlib.org.
Copyright © 2023–2025 Clayton Cafiero
No generative AI was used in producing this material. This was written the old-fashioned way.
Footnotes
i.e, not provided by Python or written by you↩︎