Econ 172
Fall 2007
Homework 1 Due Wednesday September 5
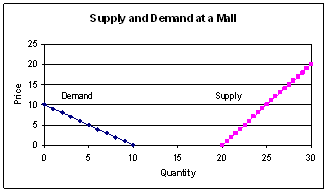
1. Use supply-and-demand graphs to explain why parking is free at the suburban shopping mall but one typically must pay to park when shopping downtown.
In the suburban shopping
mall, there are lots of parking spaces that are designed to be part of the mall
(see graphs below). Demand is fairly
small, only accounted for by shoppers and employees. Downtown has multiple uses and demand for
parking is by people who shop, people who work downtown, and for people who
live or visit others. Relative to
supply, demand is high. So in the
shopping mall, at a price of zero, quantity demanded is less than quantity
supplied. Downtown, demand intersects
supply at a positive price. Note that
during the peak shopping season, Thanksgiving through Christmas, demand for
parking at the mall (and downtown) is higher and sometimes you can’t find a
parking spot. Question: Why doesn’t the
mall charge for parking at that time so price performs its rationing
function?
(Note that prices
on the graph below are just made up)

2. During the winter
of 1997-1998, the northeastern
False.
Temperature is one of the factors that can shift the entire demand
curve. A warm winter means people will
not buy as much heating oil at a given price as they would if the winter was
colder. This statement confuses demand
with quantity demanded. The demand curve
shifted left, so quantity demanded and price fell. So the law of demand is not
contradicted.
3. In the early 1990s
the world price of coffee was high.
Today it is much lower. Before
1994,
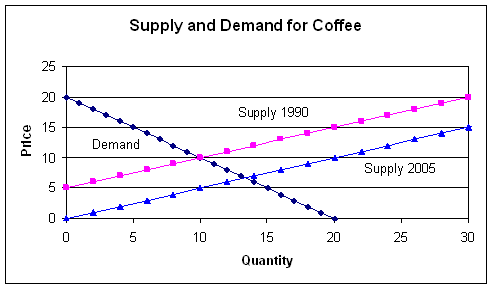 The supply curve shifted right as
4. There is currently
a big increase in the use of ethanol in the
a. the market for soybeans.
Farmers are
planting more acres in corn, and less in soybeans, so the supply curve for
soybeans shifts left, raising the price and lowering quantity.
b. the price of
products in the
Corn is an input into many products (corn flakes, corn sweetener used in soft drinks) and when its price rises, that means the cost of a factor of production rises, so we should expect to see the price of corn flakes and sodas rise.
c. the price of corn
tortillas in
Same answer as
(b). The price of corn
tortillas in
d. the price of beef
in the
Also
a shift leftward in supply, which means that the price of beef goes up.
5. Does a shift in the demand curve that raises price increase supply? Why or why not?
If the demand
curve shifts and price goes up, that must mean that it has shifted to the
right. That raises the quantity demanded
and quantity supplied, but it has NO impact on the position of the supply curve
itself. So quantity supplied rises, but
supply remains constant.
6. In the
Most media discussions of this say that (a) has caused (b). Use supply and demand analysis to show how (b) could have caused (a).
If Americans have
health insurance plans that pay most of their medical expenses,
that means that to them, the price is lower than it would be if they had
to pay all of the costs. Along a demand
curve, if the price falls, people will consume more. If they buy more medical care, then the total
spending on medical care will generally go up.
In the text, chapter 2, answer questions 1, 4, 6, and 11 and problems 19, 21 and 22.
Questions:
1. When
4. When a freeze occurs in
6. A usury law is a price ceiling on interest
rates. If there is a price ceiling, then
the price is set below the equilibrium price.
Output is less than it would otherwise be and some people will not be
able to get the amount of the good (in this case credit) as they would like to
buy if the price was higher.
11. A crackdown on cocaine smuggline
causes the supply curve to shift to the left, therefore raising price.
Problems
19. Qd = a – bP Qs = c + eP
At equilibrium Qd = Qs so a-bP = c+eP ;
therefore
a-c = bP+eP and
a-c = P(b+e)
and P = (a-c)/(b+e)
Qd = a – b[(a-c)/(b+e)] = a- [(ba-bc)/(b+e)] = ab+ae –
(ba-bc) = ae + bc
b+e b+e
and just to check that Qd
= Qs
Qs = c+e[(a-c)/(b+e)] = cb+ce + ea-ec = cb + ea
b+e
b+e
and from high school algebra you of course
know that (ae+bc)/(b+e) =
(cb+ea)/(b+e).