Water Quality
Water Quality from the Acid Lakes Monitoring

Acid rain was first detected as a serious environmental problem in the late 1960s. Emissions of sulfur dioxide (SO2) and nitrogen oxides (NOX) react with water, oxygen, and other chemicals in the atmosphere to form sulfuric and nitric acids. Resulting hydrogen ions in acid rain leach plant-necessary cations (e.g., calcium, magnesium, potassium, phosphorus) from the soil and into water bodies, and make toxic cations, like aluminum, more available. Such changes have been shown to negatively affect all levels of ecosystem health, from trees to soil microorganisms.
The Data
When high-elevation lakes in geologically sensitive areas were becoming acidified, the Environmental Protection Agency (EPA) enacted the Acid Lakes Monitoring Program, under the Long-Term Monitoring Program (LTM). In Vermont, collection is run by the Department of Environmental Conservation (DEC).
Water quality samples are collected three times a year (spring, summer, and fall). Measurements include pH, transparency, temperature, color, and concentrations of calcium, magnesium, sodium, potassium, aluminum, nitrate, sulfate, chloride and dissolved organic carbon (DOC). For most measurements, the methods of collection, processing, and analysis have remained consistent for nearly 30 years, providing long-term records water quality in VT and throughout the US.
2016 in Summary
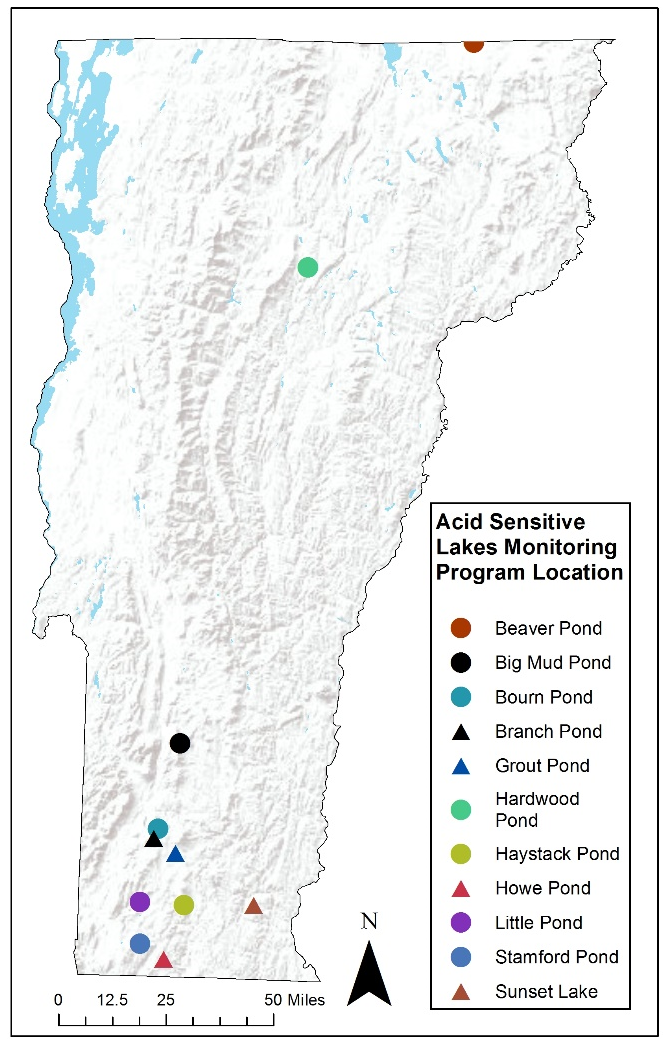
In 2016, we saw a range of values for water quality measurements in the 11 lakes and ponds in the Acid Lakes Monitoring Program (Figure 36) which reflects the variability in the different water bodies and in the parameters measured. For some, but not all, of the measured water quality parameters, average values among the 11 lakes improved from 2015.
Average pH was 5.94, which is slightly higher than the average value in 2015 (5.93), a sign of continued decreasing acidic inputs. Also a good indicator of improving water quality, dissolved aluminum decreased from 127.7 ug/L in 2015 to 93.5 ug/L in 2016 (Fig. 2).
Phosphorus concentration was about 12.6 ug/L, slightly lower than in 2015 when the average value was 13.5 ug/L. Dissolved organic carbon is a broad grouping of organic molecules resulting from decomposing organic matter. It is not only a food source for aquatic microorganisms, but is an indicator of terrestrial health. In 2016, the mean value (4.35 mg/L) declined from 2015 (4.76 mg/L).
Long-Term Trends
The data from the 11 lakes show evidence that acid accumulation and cation leaching has declined over the long-term record (1980-2016). Alkalinity and pH are both increasing over time (Figure 37). Concurrently, conductivity (a measure of the electrolyte concentration), dissolved aluminum, and dissolved calcium are decreasing.


Dissolved organic carbon has been increasing since it was first measured in the early 1990s, although there is more measurement variability among the 11 lakes for DOC compared to other measured variables, as indicated by the size of the confidence intervals around the average (Figure 37).
Phosphorus, which is easily transported in water, is an essential nutrient for all life; however, excessive concentrations can lead to algal blooms, as has been observed in Lake Champlain. Total phosphorus shows a varied pattern, but overall there is a decrease in concentration from a peak in 2008 (Figure 37).
Regional Context & Implications
Similar trends in pH and dissolved cations are evident across the region. These long-term data are proof of ecosystem recovery following the Clean Air Act and subsequent amendments, which have substantially reduced deposition of sulfur and nitrate – two components that react in the atmosphere to produce acid rain.
As acid rain was first discovered in the mid-1960s, we lack records of water quality prior to acidification. As a result, it is uncertain what measurement values designate full ecosystem recovery. Further, acid rain has not completely vanished, as we are still seeing deposition of sulfur and nitrogen on the landscape. Despite this uncertainty, the relatively quick recovery of our lakes and ponds compared to values in the 1980s supports regulation to combat acidic pollutants and continued monitoring to help protect our valuable resources. Moving forward, as the threat of acid rain declines, other types of pollutants are becoming more problematic, such as phosphorus loading in our large water bodies.

Overall, the long-term data (1980-2016), provide support that vulnerable lakes and ponds in Vermont are recovering from decades of acid rain. Moving forward, phosphorus may become more problematic as acidic inputs decline
Acknowledgements
Special thanks to Rebecca Harvey from the Vermont Department of Environmental Conservation for reviewing and editing the Water Quality Section of the 2016 FEMC Long-Term Monitoring Update.
References
- SanClements, M.D., G.P. Oelsner, D.M. McKnight, J.L. Stoddard and S.J. Nelson. 2012. New Insights into the Source of Decadal Increases of Dissolved Organic Matter in Acid Sensitive Lakes of the Northeastern United States. Environmental Science & Technology 46(6):3212-3219.
- Williamson, C.E., Overholt, E.P., Pilla, R.M., Leach, T.H., Brentrup, J.A., Knoll, L.B, Mette, E.M and Moeller, R.E. 2015. Ecological consequences of longterm browning in lakes. Scientific Reports 5. 186666.
- Monteith, D.T., J.L. Stoddard, C.D. Evans, H.A. de Wit, M. Forsius, T. Hogasen, A. Wilander, B. Skjelkvale, D.S. Jeffries, J. Vuorenmaa, B. Keller, J. Kopacek, and J. Vesely. 2007. Dissolved organic carbon trends resulting from changes in atmospheric deposition chemistry. Nature 450(7169): 537-540.
- Lawrence, G.B, J.E. Dukett, N. Houck, P. Snyder, and S. Capone. 2013. Environmental Science and Technolology. 47 (13): 7095–7100
- Recovering from Acidification. Environmental Science and Technolology. 47 (13): 7095–7100
Additional Resources
- Vermont Department of Envrionmental Conservation. Vermont Integrated Watershed Information System. Accessible at https://anrweb.vt.gov/DEC/IWIS/
- Vermont Monitoring Programs for Acid Rain: http://www.watershedmanagement.vt.gov/bass/htm/bs_acidrain-mon.htm
- US Environmental Protection Agency Long Term Monitoring Program: http://www2.epa.gov/airmarkets/monitoring-surface-water-chemistry
FEMC Project Database Link
- Long Term Monitoring of Acid Sensitive Lakes https://www.uvm.edu/femc/data/archive/project/long-term-monitoring-acid-sensitive-lakes