Acid Deposition
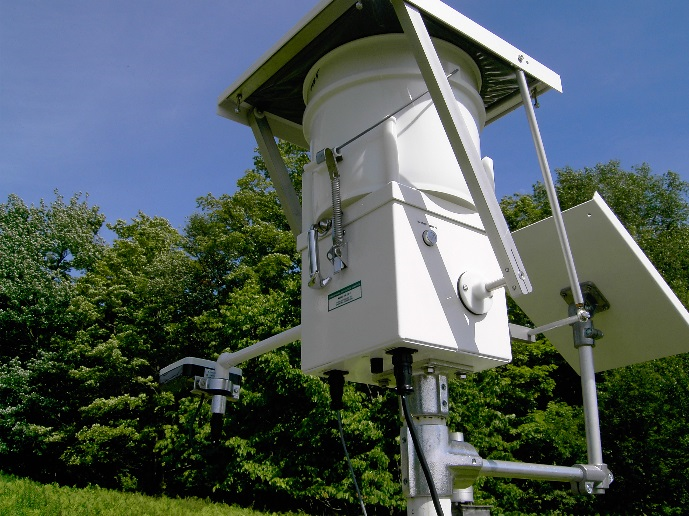
National Atmospheric Deposition Program/National Trends Network
Atmospheric deposition and its impacts on the forested landscape have been well documented over the past several decades. As atmospheric inputs have accumulated on the landscape there have been numerous studies documenting the cascading impacts on ecosystems, such as the dieback of red spruce in the 1970s and 80s, soil cation leaching and water quality impacts to name a few. These studies are made possible by the availability of long-term atmospheric deposition monitoring. The Underhill NADP/NTN site has been a cornerstone of VMC monitoring and research, providing key information on the sources of pollution, trends in deposition rates and impacts on forested ecosystems. Today, this information is necessary to understand how air quality policies have ameliorated acid deposition across the region, and to inform future policy and management decisions to sustain the health of the region’s forested ecosystems.
The Data
Atmospheric deposition monitoring has been conducted by the Vermont Monitoring Cooperative for over thirty years at the Proctor Maple Research Center and Lye Brook Wilderness Area in southern Vermont (monitoring station located in Bennington). These stations are part of several national (The National Atmospheric Deposition Program – NADP, National Trends Network – NTN, Atmospheric Integration Research Monitoring Network -AIRMoN) or statewide (Vermont Acid Precipitation Monitoring Program - VAPMP) networks, which enable the monitoring of both spatial and temporal patterns of acidic deposition. These networks consist of over 200 sites in the continental U.S. allowing us to better understand trends in acid deposition in Vermont and how they compare to other regions.
Here we examine the NADP/NTN datasets collected at the Proctor Maple Research Center on the western slopes of Mount Mansfield, Vermont. This record contains a 30-year record of pH, NO3 and SO4 measurements for weekly composite precipitation samples.
2015 in Summary
For all three deposition metrics (pH, SO4 and NO3), 2015 continued the trend of reduced pollution concentrations over historical measurements (Figure 10, Table 3). pH was the best year on record with a mean weekly composite of 5.1 . While this is up significantly from the historical low of 4.4, “unpolluted” rain typically has a pH of 5.6, indicating that there is still room for continued improvement. As pH is a logarithmic scale this represents a roughly fivefold improvement in acidity.


SO4, a primary component of acid deposition, also set a new record in 2015 with the lowest concentrations on record. NO3 concentrations in 2015 was in the lowest quartile of measurements for the 31-year record, and marks the fourth year in a row where NO3 deposition exceeded that of SO4. In the early years of acid rain monitoring in Vermont, sulfates accounted for about 2/3 and nitrates 1/3 of the acidity in our precipitation. Over time, upwind emissions of both sulfur oxides (SOX) and nitrogen oxides (NOX) have declined. However, the reductions in SOX have been proportionately greater than reductions in NOX. While the stress imposed by SOx deposition has been greatly reduced, it is unclear how the continued deposition of NOx will impact forested ecosystems, especially since emissions and deposition of reduced nitrogen (NHX) have not yet declined.
Long-term Trends
The VMC record on acid precipitation dates back to the early 1980s. Over that time, acid deposition in Vermont reflects decreasing emissions resulting from the Clean Air Act and amendments in 1977 and 1990. This includes decreases in both sulfate and nitrate pollution, and a corresponding increase in precipitation pH (Figure 11). However, the most significant reductions are witnessed in sulfate, with more modest changes in nitrate. This primarily stems from the relative difficulty removing nitrogen compounds from flue gases and their diffuse pollution sources such as motor vehicle exhaust and agricultural activities.

Looking at the most recent trends (considering only the past several years), it is likely that reductions in SO4 may continue (Figure 8). However, it appears that reductions in NO3 concentrations have leveled off. Because NOx pollution primarily comes from diffuse sources such as automobile exhaust, fertilizer use and confinement farming such as feedlots and poultry operations in agricultural regions, it is likely that continued reductions may require additional legislative or regulatory action.
Implications
Vermont is in relatively good shape compared to nitrogen pollution loads nationwide (Figure 9). However, forests along the spine of the Green Mountains are still particularly susceptible due to more frequent exposure to acid mist in clouds, higher levels of precipitation and relatively shallow soils. This makes high elevation ecosystems particularly sensitive to secondary stress agents. As nitrogen becomes a more important constituent of acid deposition, monitoring networks and modelers are combining resources to better understand the spatial and temporal patterns of nitrogen deposition and its impacts on terrestrial and aquatic ecosystems.


Overall, acid deposition is a regulatory success story, but pH remains below “clean” levels and NOx deposition is no longer improving. Many sensitive ecosystems may still be susceptible to adverse impacts.
Additional Resources
- National Atmpospheric Deposition Program. http://nadp.sws.uiuc.edu/
- EARTH: The Science Behind the Headlines. American Geosciences Institute. http://www.earthmagazine.org/
VMC Project Database Link
- National Atmospheric Deposition Program/National Trends Network (NADP/NTN) https://www.uvm.edu/femc/project/national-atmospheric-deposition-programnational-trends-network