Forest Health
Long-Term Canopy Condition and Regeneration
Long-term trends in tree health provide information on the condition and vigor of Vermont’s forests. Assessing tree canopy condition and seedling regeneration help us monitor the status of our forest, as well as detect change. Trees with healthier, denser foliage can sequester more carbon, add more wood annually, and better resist pests and pathogen outbreaks. Measuring regeneration gives us a sense of what our forest may look like in the future. In any one year, crown health metrics may vary due to weather events and/or insect or disease outbreaks. Therefore, the long-term species trends give us context for the annual observations. As our climate continues to change, monitoring forest health trends will be critical.
The Data
In 1990, a national Forest Health Monitoring (FHM) program was established to measure forest health and detect emerging problems. Following this protocol, the Forest Ecosystem Monitoring Cooperative (formerly the Vermont Monitoring Cooperative) established 49 FHM plots in Vermont between 1991 and 2016. In addition to the original 19 plots measured from 1991-2014, 22 plots were added in 2015, 7 plots were added in 2016, and one additional plot was added in 2018.
The 49 Vermont FHM plots contain 1,626 mature trees from 30 species, spanning 8 forest types and 8 biophysical regions. Annually, crews assess tree species, canopy condition, seedling abundance, sapling survivorship, invasive species, and damage agents. Crown health assessments include early symptoms of tree stress, such as changes in foliage transparency, crown dieback, and tree vigor. Elevated crown transparency can suggest either short or long-term decline, while crown dieback is a metric for more serious decline symptoms. Tree vigor is an assessment of the overall health of the tree. Vigorous trees are healthy and resistant to stress and strain from damaging agents.
Regeneration counts provide an estimate of the relative success of germination and initial survivorship across species from year to year. Saplings (1 to <5 inches in diameter) have been measured on the 19 original FEMC plots between 1997 and 2007, and then again starting in 2014. From 2008 to 2013, the plots were measured on a 3-year rotation. Seedlings (<1 inch in diameter and greater than 12 inches tall for hardwoods or 6 inches tall for softwoods) have been measured periodically during that time as well. Beginning in 2014, all seedlings of any height have been tallied yearly. Regeneration serves as a proxy for the future composition of the forest canopy. In total, the information obtained from this plot network provides a robust estimate of the current condof Vermont’s forests, providing early indications of potential problems that may affect forests across Vermont and beyond.
2018 in Summary
Crown Health
In 2018, for all selected tree species[1], mean crown dieback increased compared to 2017. For the selected species, elevated levels of crown dieback were observed for all species when compared to long-term trends (Table 1). Eastern white pine and eastern hemlock experienced the lowest levels of crown dieback in 2018 (less than 1 standard deviation from the long-term mean) (Table 1). White ash, northern red oak, and red maple experienced the highest levels of crown dieback in 2018 relative to the long-term mean. The average crown dieback, observed in 2018 for select species (12%), was greater than in 2017 average (10%) and it was greater than the long-term average (8%). While any one year can have events that stress trees (e.g., drought, insects, disease), multiple years of increased dieback can be cause for concern.
The average foliar transparency of tree crowns measured in 2018 was 23%, which was greater than the 2017 average (15%) and the long-term average (20%) (Table 1). Eastern white pine had the highest levels of crown transparency in 2018 (24%) which represents a 10% increase when compared to the long-term trend.
For the 2018 annual report, we have summarized trends in tree vigor, which is an assessment of a tree’s overall health. We compared the proportion of trees that were identified as having poor vigor to all trees assessed in 2018 and for a four-year period when vigor data were collected (2014 to 2018). For the select species listed in Table 1, the proportion of poor vigor trees was 11% in 2018 which is slightly higher than the five-year average of 10%. Northern red oak and eastern white pine showed the greatest increase in proportion of poor vigor trees in 2018 in comparison to the four-year average for those species. While northern red oak and white pine do show a significant increase in poor vigor rating compared to the mean, tree vigor assessments were only conducted on 22 plots in 2014 which likely underrepresents these species. However, the trend over the measurement period does indicate an increasing proportion of poor vigor rating for red oak and white pine.
Overstory trees
For all living overstory trees measured in 2018, sugar maple was the predominate species across the plot network with 299 trees measured at a density of 93 trees per hectare (tph; 38 trees per acre (tpa)) (Figure 1). Balsam fir was the second most abundant overstory tree species (269 trees, 84 tph, 34 tpa), followed by red maple (185 trees, 58 tph, and 23 tpa), red spruce (159 trees, 49 tph, and 20 tpa), yellow birch (157 trees, 46 tph, and 19 tpa), American beech (139 trees, 43 tph, and 17 tpa), and Eastern hemlock (116 trees, 36 tph, and 15 tpa) (Figure 1).
Regeneration
Across the plot network, the sapling layer remained relatively stable over the past year. Balsam fir decreased slightly from the previous year’s measurement of 167 live stems to 164 live stems (635 tph; 257 tpa) (Figure 1). American beech remained the second most abundant species in the sapling layer with 80 live stems tallied (310 tph; 126 tpa) (Figure 1). Red spruce (52 stems, 201 tph, and 81 tpa), striped maple (16 stems, 62 tph, and 25 tpa), and yellow birch and sugar maple (both with 13 stems, 50 tph, and 20 tpa) are among the most abundant species in the sapling layer. Together, these results indicate little change in sapling composition in the past year, which is to be expected given the low rates of natural disturbance within the forest types represented and due to the lack of canopy disturbance resulting from forest management. The sapling layer represents those tree species that have the potential of growing into the overstory. We have not seen increased rates of sapling mortality in recent years which does suggest the potential for new trees to be recruited into the overstory if additional growing space is made available.
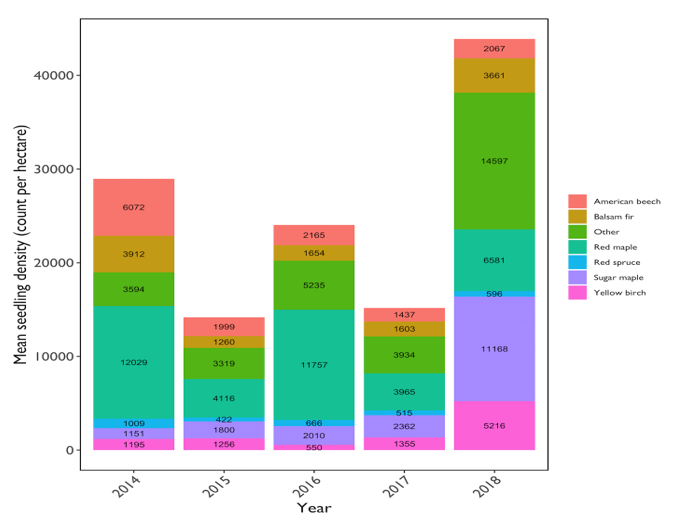
In 2018, we saw an increase in total seedling regeneration of the selected species relative to 2017. As some tree species experience heavier and lighter seed years, annual fluctuations are expected. 2017 was an excellent seed year for many of the common species found in Vermont forests, which may have had a positive influence on 2018 seedling counts. A good seed year may also have coincided with favorable germination and growing conditions. Sugar maple seedling regeneration was recorded to be 11,168 stems per hectare (4,521 stems per acre), which represents a major increase from the 2017 measurement (2,362 stems per hectare; 956 stems per acre). American beech (2,067 stems per hectare; 836 stems per acre), balsam fir (3,661 stems per hectare; 1482 stems per acres), red maple (6,581 stems per hectare; 2,664 stems per acre), red spruce (595 stems per hectare; 241 stems per acre), and yellow birch (5,216 stems per hectare; 2,112 stems per acre) all experienced increased levels of seedling regeneration in 2018 (Figure 2). Seedling densities are shown as two distinct size class. Class 1 seedlings are < 12 inches tall for hardwoods and < 6 inches tall for softwoods. Class 2 are all seedlings < 1 inch in diameter and are not included in class 2.
Long-Term Trends
Crown health
An examination of the full temporal dataset allows us to look past the year-to-year variability to consider species-specific trends and identify more chronic stress conditions. It is evident that there is a high annual variability in the crown health metrics, and particularly for certain tree species. White ash and paper birch show a trend of increasing foliage transparency over the past ten years compared to the long term average. The total number of trees assessed has increased every year due to the inclusion of additional monitoring plots which may have had an impact on observed trends in crown health metrics. Red oak has experienced a slight increase in crown transparency over the past four years while sugar maple appears to be experiencing a decreasing crown transparency trend (Figure 3). Sugar maple, however, appears to have increasing levels of crown dieback over the past five years (Figure 3). White ash, yellow birch, red maple, paper birch and red oak are all likely experiencing higher than average levels of crown dieback over the past four years (Figure 3).
Tree vigor is a measure of a tree’s overall health. During annual data collection, each tree that is measured is assigned a vigor rating from 1-5, with 5 being dead. A vigor rating of 1 (excellent health), indicates a tree that is in good health with less than 10 percent crown dieback, minimal to no branch mortality, defoliation, or crown discoloration. A tree with a vigor rating of 4 (poor health) indicates that the tree has elevated levels of branch mortality, crown dieback, and more than 50% crown defoliation and/or crown discoloration. To assess the long-term trends in average tree vigor across all plots in the FMH program, we assessed the percent of all live trees that were identified as having poor vigor (vigor rating of 3 or 4) relative to the total number of trees. The proportion of poor vigor trees in the sampling population represents another useful metric to assess changes in overall forest health over time. Vigor rating began in 2014; therefore, we present the trend from 2014 to 2018.
The proportion of poor vigor trees has remained stable for most species across all monitoring plots over the past five years, with the exception of red oak, which show signs of elevated proportions of poor vigor trees (Figure 4). The increase in white pine trees assessed as “poor vigor” in 2018 may be a result of white pine needle disease which had large impacts in the past two years.
Tree regeneration
In 2018, overall seedling density was greater than in previous years (Figure 5). It is important to note that a protocol change, implemented in 2014, expanded the definition of seedlings to capture recent germinants. Prior to 2014, seedlings were only counted when they exceeded a certain height (6” for conifers, 12” for hardwoods, as per FIA protocol). Since 2014, all seedlings with true leaves and smaller than 1” diameter were counted. Therefore, we have chosen to present the trends in tree regeneration for the five-year period from 2014 to 2018.
Seedling densities (stems per hectare) increased in 2018 when compared to the preceding four years. Sugar maple, yellow birch, and balsam fir regeneration increased substantially in 2018 (Figure 5). Other species commonly found at lower relative abundances also experienced increases in seedling regeneration in 2018. Hop hornbeam, American mountain-ash, and striped maple all showed large increases in seedling regeneration when compared to the past four years. In 2018, northern red oak seedling densities were the second highest recorded since 2014 (129 stems per hectare) but lower in comparison to 2017 (248 stems per hectare). Eastern white pine seedling densities were the highest recorded since 2014 (398 stems per hectare).
Long-term seedling regeneration trends appear to indicate that 2018 was a favorable year for tree regeneration across many commonly found tree species in Vermont. The increase in seedling regeneration may have been related to the abundance of seed observed in 2017.
Regional Context & Implications
Long-term forest health monitoring has allowed us to detect subtle but steady changes in the condition of our forests. Long-term trends indicate that some species continue to fare better than others. Examination of metrics for other species indicates long-term trends that warrant ongoing monitoring of declining condition, particularly for paper birch, red oak, and white ash.
Forested ecosystems provide immeasurable benefits to society; from their aesthetic beauty and recreational opportunities, to biomass energy and carbon sequestration. While the composition of forests may change over time, ongoing work to monitor tree health and regeneration will inform forest management decisions to maximize forest resiliency, productivity, and health of Vermont’s forests.
Long-term trends continue to show declining tree crown health for white ash and paper birch, while others species continue to remain stable. 2018 proved to be an impressive year for tree seedling regeneration across Vermont.
Acknowledgements:
Special thanks to Josh Halman from the Vermont Forest Parks and Recreation Department for reviewing and editing the Forest Health Section of the 2018 FEMC Long-Term Monitoring Update.
Additional Resources
VT Forests, Parks and Recreation Vermont Forest Health Highlights 2018 https://fpr.vermont.gov/sites/fpr/files/Forest_and_Forestry/Forest_Health/Library/2018%20VT%20Forest%20Health%20Highlights.pdf
VT Forest Insects and Disease Conditions 2018 https://fpr.vermont.gov/sites/fpr/files/Forest_and_Forestry/Forest_Health/Library/2018%20Conditions%20report.pdf
FEMC Project Database Links
Forest health monitoring: https://www.uvm.edu/femc/data/archive/project/forest-health-monitoring
[1] Eleven tree species were selected for crown health assessments based on their density (trees per hectare) across the FHM plot network.