Climate
Climate Monitoring in Vermont and the Northeast

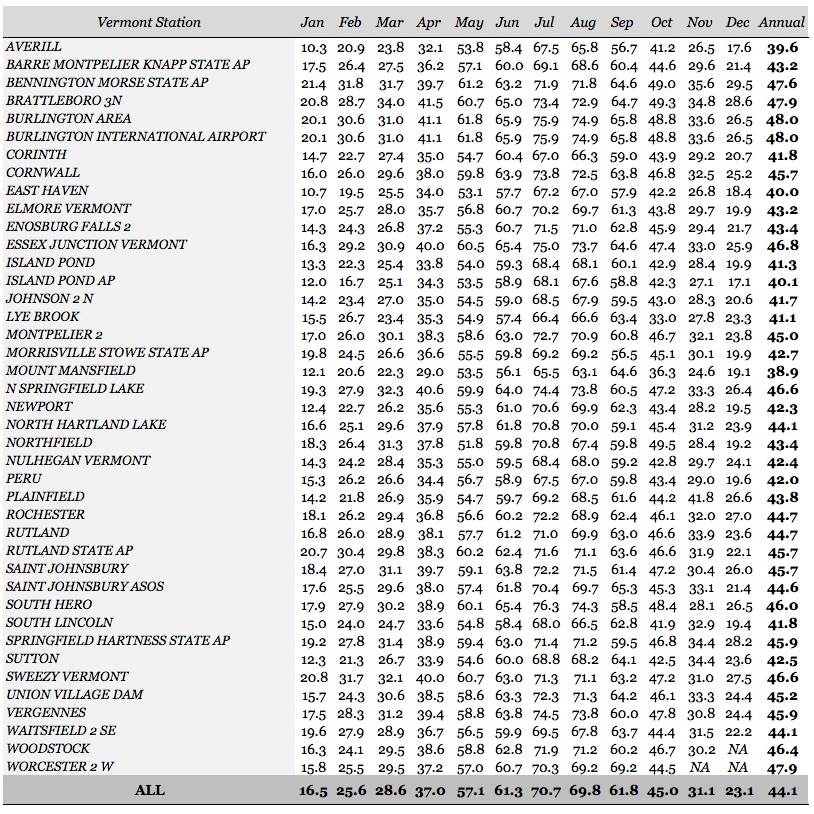
The Forest Ecosystem Monitoring Cooperative (FEMC) has been monitoring weather conditions in Vermont for over 20 years. FEMC currently operates seven meteorological stations across a range of elevations and cover types, maintaining real-time data streams and archiving of long-term data. In addition, the Northeast Regional Climate Center[5] (NRCC) provides detailed information on trends in climate and weather for the Northeast.
Weather and climate are related but very different phenomena: weather being the condition of the atmosphere (precipitation, temperature, etc.) over the short term, while climate refers to longer-term trends and seasonal patterns. Without long-term weather records it would be impossible to tease out short term (i.e. yearly) anomalies from more ecologically significant climate trends, which makes this information critical to scientists and planners of all kinds. To add temporal and spatial depth to our summary, we summarize trends from a 12-state region (Connecticut, Delaware, Maine, Maryland, Massachusetts, New Hampshire, New Jersey, New York, Pennsylvania, Rhode Island, Vermont and West Virginia) using records from the NRCC. This approach provides a broader picture of emerging trends across a larger region. Much of the following regional summary is adapted, with permission, from the NRCC annual summary[6] .
Vermont Summary
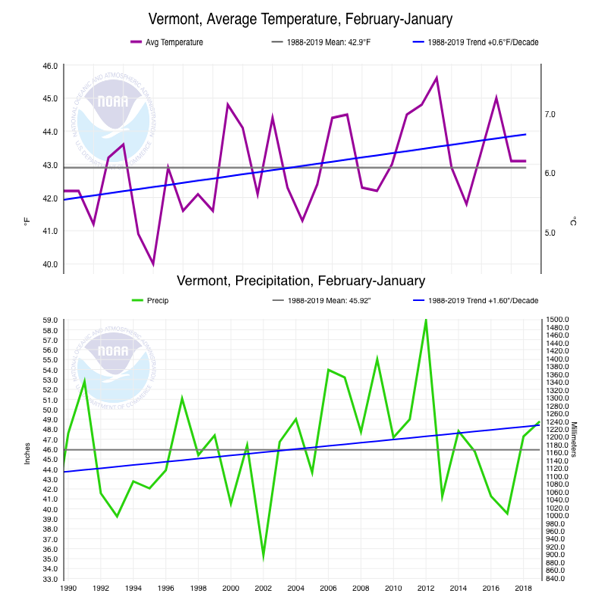
The annual state-wide average temperature for 2018 was less than 1°F above the average for the last 30 years, but lower than the previous two years. 2018 marked a slightly warmer than average winter for Vermont. Summer temperatures in 2018 were slightly above the 30-year average and warmer than the previous two years. Annual precipitation in Vermont for 2018 was approximately 47.28” which was slightly higher than 2017 (46.30) and 1.61” higher than the 30-year average (Figure 17).
Regional Summary
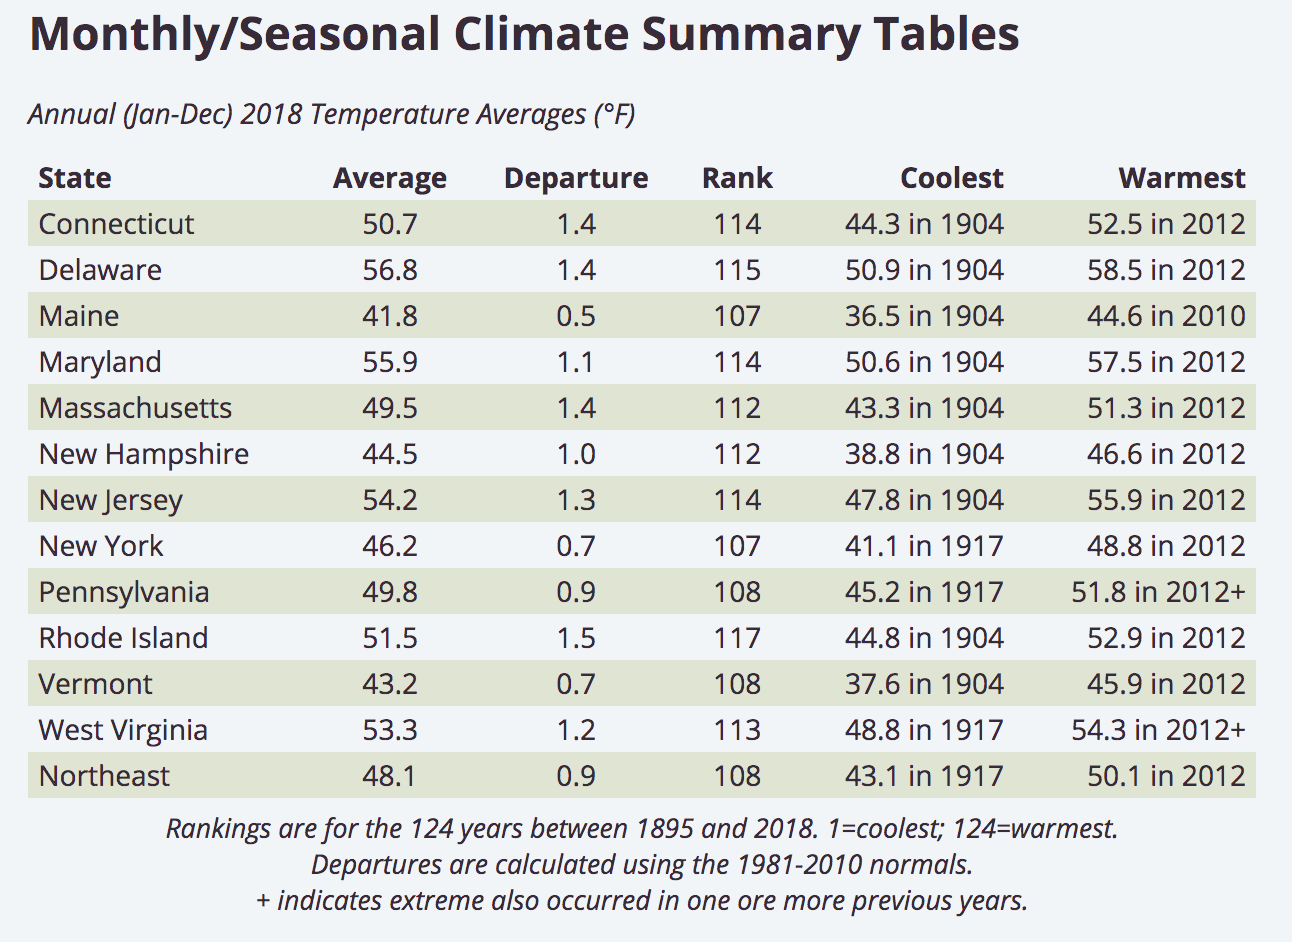
The climate pattern in the Northeast during 2018 is generally one of warmer than normal temperatures (Table 5) with annual precipitation varying from below to above average regionally. The average temperature for the twelve-state Northeast region was 48.1 °F making it the 17th warmest since recording began in 1895. All states had a warmer than average year.
The first three months of the year, below normal January temperatures were reported in central and southern New England States, while northern New England states experienced above normal January temperatures. February was the third warmest on record for the region in 2018 (32.1°F, 5.9 °F above normal). On the 20th-21st of February, 2018 twenty weather stations across the region recorded their highest or tied their highest temperatures to date. Spring, summer and fall temperatures varied across the region. August and September were warmer than the observed normal across the entire region.
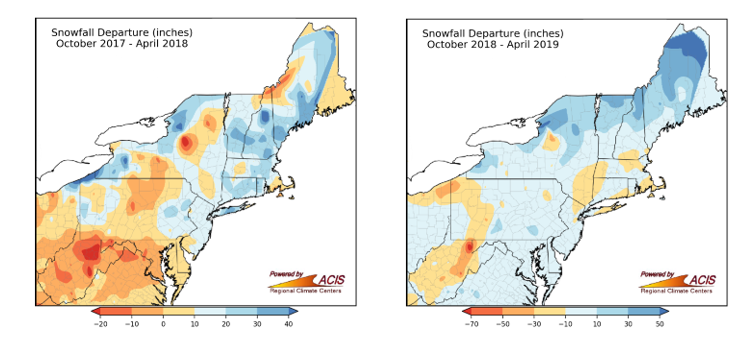
The above average late summer and early fall temperatures of 2018 shifted in November as an unseasonably cold air mass settled over the region and resulted in some of the coldest November temperatures recorded in the region. Snowfall varied across the region in the beginning of 2018 with New Hampshire, Vermont, Massachusetts, Connecticut, and Rhode Island experiencing above average snow fall (Figure 18). Snow fall was consistently above average across the region the winter of 2018-2019.
Rainfall
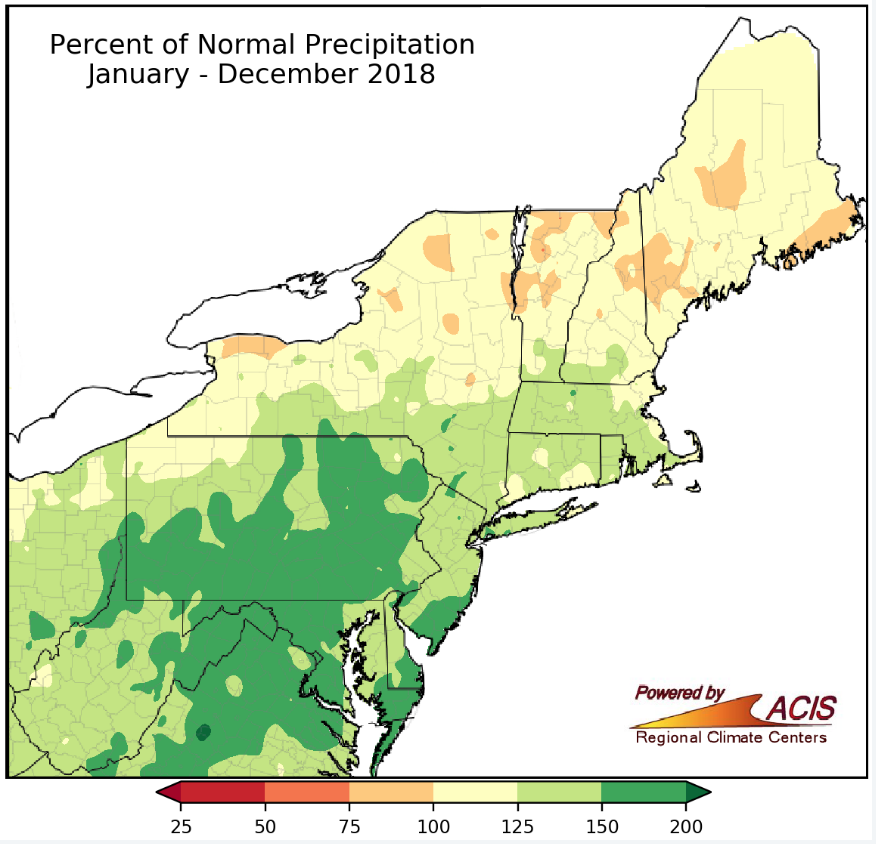
In 2018 the Northeast experienced the second wettest year on record receiving 56.30 inches, representing a 20% increase from the regional average. The majority of the increased precipitation occurred in the southern states, while the northern states experienced precipitation at or slightly below average (Figure 19). Autumn in the Northeast was the wettest on record with 17.43 inches of precipitation received (50%) increase from recorded mean.
The above average precipitation was contrasted with drought conditions across the region. Beginning in the early spring in northern New England, drought conditions expanded and intensified as the summer progressed. In July, the U.S. Drought Monitor showed 6 percent of the Northeast in a moderate drought and 27 percent as abnormally dry. These drought conditions persisted through the fall, but the abundant rainfall during November eased drought across the region.
Implications
While climate variability is high, both temporally and spatially, meteorological measurements witnessed across the Northeast are in agreement with local and national assessments indicating that temperatures have increased over the past several decades (Betts, 2011; EPA, 2014; IPCC, 2014). However, it is not the general warming trends that will likely impact forested ecosystems the most in the near future. Instead, it is the increased frequency and severity of extreme climate events that are of concern. The increase in extreme temperatures witnessed in 2018 are an example of the increase in variability we will continue to see under a changing climate. These extremes represent an additional stress for species adapted to cold weather dormancy, increased risk of winter injury following winter warm spells, and frost damage during spring freeze events. Even when climate conditions remain within a species’ natural tolerance, differences in competitive advantages among species due to phenological changes or erratic and unseasonable temperature fluctuations could alter ecosystem structure and function (Pucko, 2014).
Variable temperatures may eventually affect phenological adaptations, potentially increasing vulnerability to insects, diseases, and may have an adverse impact on major agricultural crops in Vermont such as apples and sugar maples (Grubinger, 2011; Rustad, 2012).
Acknowledgements
A special thank you to NOAA and Jessica Spaccio from the Northeast Regional Climate Center at Cornell University for the use of their regional data, draft review, and their generous permission to adapt their regional climate summary.
References
Ambient Air Monitoring for Ozone:
https://www.uvm.edu/femc/data/archive/project/ambient-air-monitoring-for-ozone
Betts, A. K. 2011. Climate Change in Vermont (unpublished report). Available online:
EPA Climate Leaders Summit Report. Summit Date: Friday, November 8, 2013
Johnson & Wales University, Harborside Campus, Providence RI. Report Date:
March 2014. Available online:
Grubinger, V. 2011. Climate Change and Vermont Agriculture. University of Vermont Extension. Available online: http://www.uvm.edu/vtvegandberry/factsheets/climatechange.html
Intergovernmental Panel on Climate Change (IPCC) Climate Change 2014 Synthesis report Summary for Policymakers. IPCC, 2014: Climate Change 2014: Synthesis Report. Contribution of Working Groups I, II and III to the Fifth Assessment Report of the Intergovernmental Panel on Climate Change [Core Writing Team, R.K. Pachauri and L.A. Meyer (eds.)]. IPCC, Geneva, Switzerland, 151 pp. Available online: https://archive.ipcc.ch/pdf/assessmentreport/ar5/syr/SYR_AR5_FINAL_full_wcover.pdf
Pucko, C. 2014. The Impacts of Multiple Anthropogenic Disturbances on the Montane Forests of the Green Mountains, Vermont, USA. University of Vermont, Department of Biology Ph.D. Thesis.
Rustad, L. et al. 2012. Changing Climate, Changing Forests: The Impacts of Climate Change on Forests of the Northeastern United States and Eastern Canada. Gen. Tech. Rep. NRS-99. Newtown Square, PA: U.S. Department of Agriculture, Forest Service, Northern Research Station. 48 p. Available online: http://www.fs.fed.us/nrs/pubs/gtr/gtr_nrs99.pdf
Additional Resources
Vermont State Climatologist: http://www.uvm.edu/~vtstclim/
Northeast Regional Climate Center (NRCC): http://www.nrcc.cornell.edu/
NRCC Data Online: http://climod2.nrcc.cornell.edu/
NOAA Climate At A Glance: https://www.ncdc.noaa.gov/cag/time-series/
FEMC Weather Database: https://www.uvm.edu/femc/data/archive/project/themes#air+weather If
NOAA National Centers for Environmental information, Climate at a Glance: Statewide Time Series, published September 2019, retrieved on October 7, 2019 from https://www.ncdc.noaa.gov/cag/global/time-series/
[4] http://www.nrcc.cornell.edu/
[5] http://www.nrcc.cornell.edu/regional/narrative/narrative.html