Forest Health
Long-Term Canopy Condition and Regeneration
Long-term trends in tree health provide information on the condition and vigor of Vermont’s forests. Assessing tree crown condition and regeneration allow us to monitor the status of our forest, as well as detect change. Trees with healthier, denser foliage can sequester more carbon, add more wood annually, and better resist pests and pathogen outbreaks. Measuring regeneration gives us a sense of what our forest may look like in the future. While in any one year, crown health metrics may vary due to weather events and/or insect or disease outbreaks, the long-term species trends give us context for the annual observations. As our climate continues to change, monitoring forest health trends will be critical.
The Data
In 1990, a national Forest Health Monitoring (FHM) program was established to measure forest health and detect emerging problems. Following this protocol, the Forest Ecosystem Monitoring Cooperative (formerly the Vermont Monitoring Cooperative) established 48 FHM plots in Vermont between 1991 and 2016. In addition to the original 19 plots measured from 1991-2014, 22 plots were added in 2015, and 7 more in 2016.
The 48 Vermont FHM plots contain 1,983 mature trees from 31 species, spanning 8 forest types and 8 biophysical regions. Annually, crews assess tree species, canopy condition, seedling abundance, sapling survivorship, invasive species, and damage agents. Crown health assessments include early symptoms of tree stress, such as changes in foliage transparency, crown dieback, and live crown ratio. Elevated crown transparency can suggest either short or long-term decline, while crown dieback is a metric for more serious decline symptoms. Live crown ratio measures the percentage of the tree height with live foliage. From 2008 to 2013, the plots were measured on a 3-year rotation.
Regeneration counts provide an estimate of the relative success of germination and initial survivorship across species from year to year. Saplings (1 to <5 inches in diameter) have been measured on the 19 original FEMC plots between 1997 and 2007, and then again starting in 2014. Seedlings (<1 inch and greater than 12 inches for hardwoods or 6 inches for softwoods) have been measured periodically during that time as well. In beginning in 2014, all seedlings of any height have been tallied yearly. Regeneration serves as a proxy for the future composition of the forest canopy. In total, the information obtained from this plot network provides a robust estimate of the current condition of Vermont’s forests, providing early indications of potential problems that may affect forests across Vermont and beyond.
2017 in Summary
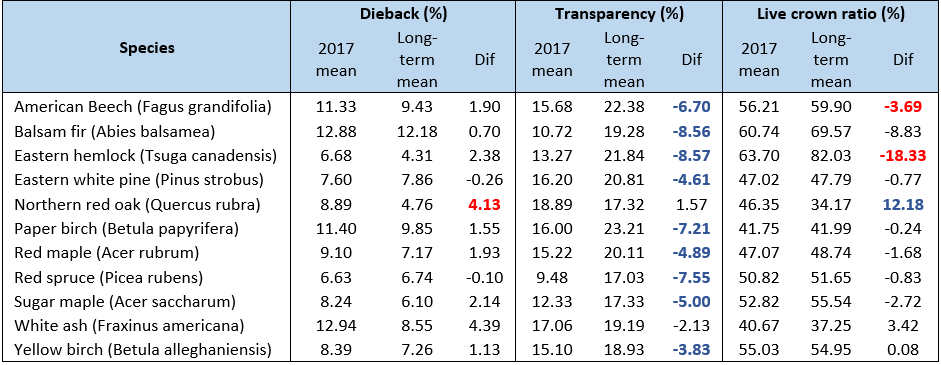
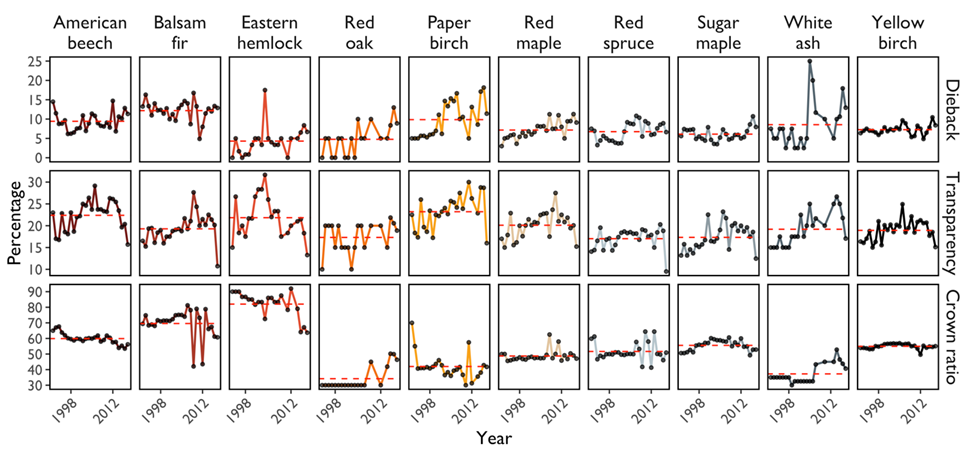
Crown Health:In 2017, for all selected tree species, mean dieback decreased compared to 2016. Only one species, red oak, showed elevated dieback (8.9%) levels compared to the long-term trend (1991-2017). Overall dieback across all species was 9.6%, which is lower than the mean in 2016 (12.2%), but still represents an increase compared to the long-term average (8.1%). While any one year can have events that stress trees (e.g., drought, insects, disease), multiple years of increased dieback can be cause for concern.
For most tree species, crown transparency decreased (e.g., improved) in 2017 compared to 2016. At 14.9%, average crown transparency was lower in 2017 than in 2016 (20.7%), and lower than the long-term average (20.5%). The only species that did not exhibit a decrease in crown transparency were red oak and white ash.
Red oak showed an increase in live crown ratio in 2017, indicating an overall trend of increased foliage relative to total height. Conversely, other species (American beech and eastern hemlock) exhibited a decline in live crown ratio. In 2017, the average live crown ratio across all species was 50.7%, which is slightly lower than the 2016 value (52.7%) and the long-term average (51.5%).
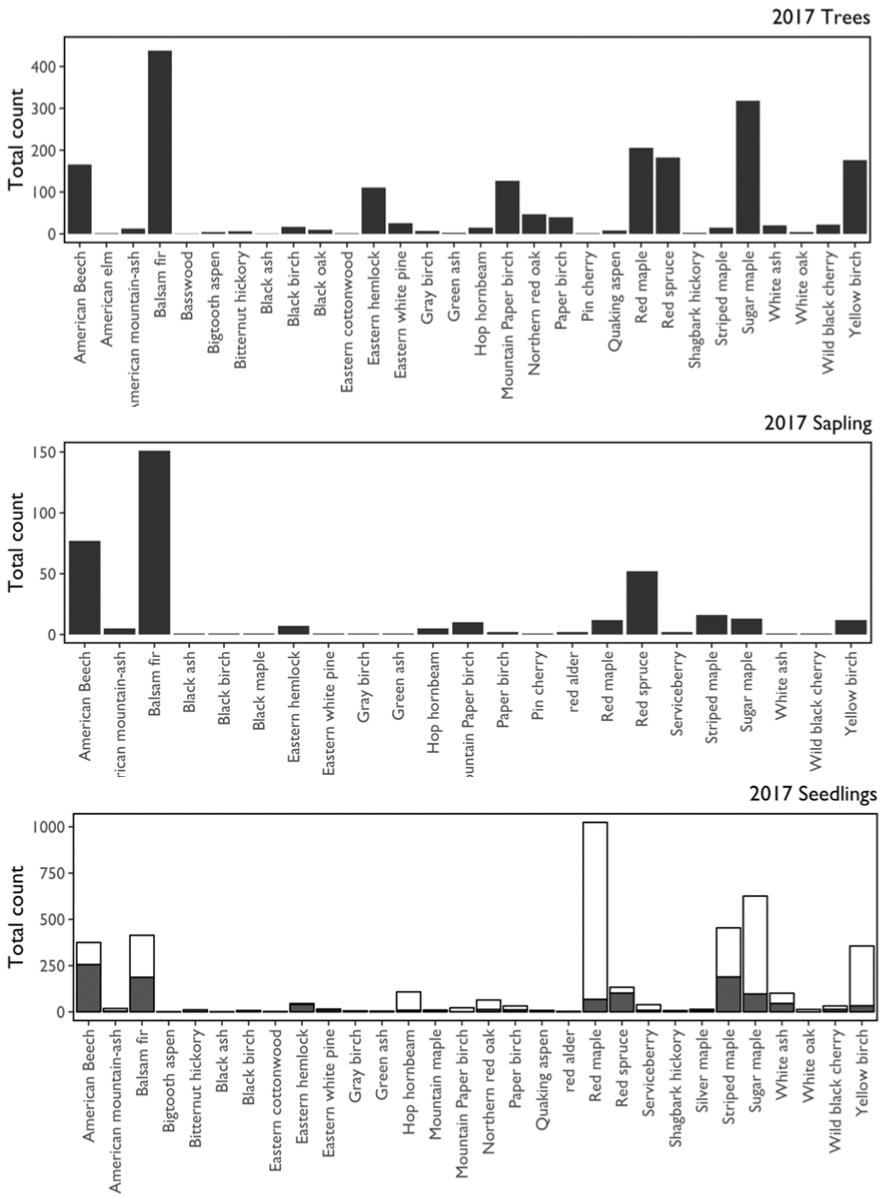
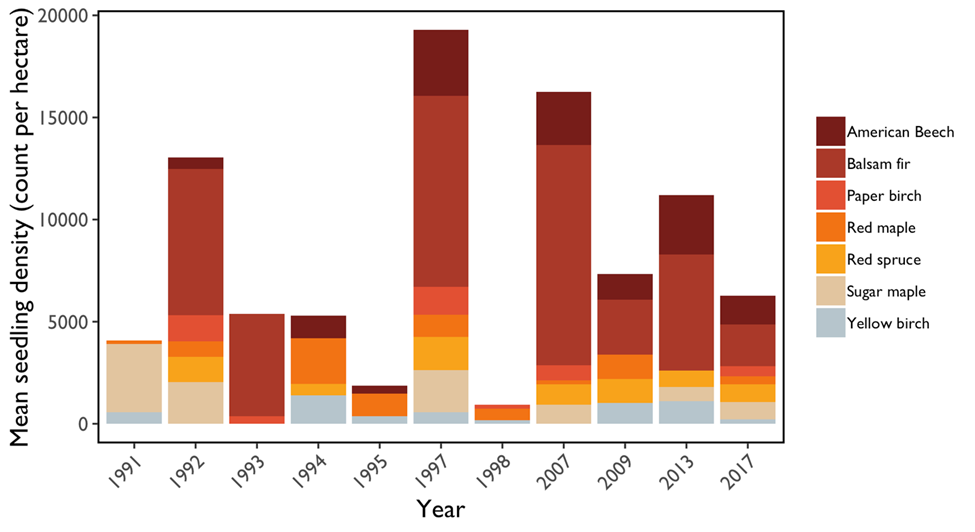
In 2017, we saw high regeneration of red maple, sugar maple, yellow birch, and striped maple (Figure 1). However, overall there was a decrease in regeneration of selected tree species relative to 2016 (Figure 3). As some tree species produce heavier and lighter seed years, annual fluctuations in seedling densities are expected to some degree. Since 2014, we have seen a high density of red maple seedlings in the FHM plots; however, in 2017 the mean density of red maple decreased (5,767 seedlings per hectare) compared to 2016 and was comparable to densities of sugar maple (5,540 seedlings/ha) and balsam fir (4,526 seedlings/ha) seedlings (data not shown). Compared to the previous two years, American beech regeneration was slightly depressed. Yet, American beech seedlings were still a considerable component of the understory, though in slightly lower densities than in 2016.
For dominant and codominant trees measured in 2017, balsam fir dominated the plots (438 trees), followed by sugar maple (318) and red maple (206) (Figure 1). There were many more species detected as seedlings (although this does include some woody species that remain shrubs or small trees) compared to mature trees. In 2017 there were some uncommon species detected in the plots, including black gum and basswood.
Long Term Trends
An examination of the full temporal dataset allows us to look past the year-to-year variability to consider species-specific trends and identify more chronic stress conditions. It is evident that there is high annual variability in all three crown health metrics, and particularly for certain tree species. Mean crown dieback has remained consistent for most species over the measurement period (Figure 2). The exceptions are paper birch and white ash, which have both experienced increased dieback over recent years. Mean crown transparency values have steadily increased for many of the species examined, with white ash and paper birch showing the most dramatic increase. Steady increases in crown dieback are worrying; this could indicate broad spatial trends in elevated tree stress and decline. For nearly all species, crown health in 2017 worsened compared to 2016 measures. (Figure 2). The FEMC will continue to monitor these species to understand how changing environmental conditions are altering forest health or competitive relationships.
Regeneration trends over time on a subset of plots
Total seedling density across a subset of the total plot network (19 plots) showed that balsam fir and American beech dominated, however, seedling densities of sugar maple were also high (Figure 3). Seedling patterns vary dramatically across plots due to the broad geographic and elevational range of the locations, which span many forest types. Given the regional economic and ecological importance of sugar maple, and apparent dominance of red maple regeneration in northern hardwood stands, further monitoring is warranted to understand the trends and patterns of sugar maple regeneration.
Looking only at established seedlings (class 2 seedlings: hardwoods >12 inches tall, softwoods >6 inches tall, Figure 3), trends in overall abundance of established seedlings on Mt. Mansfield plots fluctuate, with 2017 appearing similar to some previous assessments and different from others. 2017 shows an increase in established seedlings for sugar maple over the most recent 10-year period, but still a much lower representation than found in the early 1990s. Paper birch and red maple made up a larger proportion of seedlings than in previous years.
Regional Context & Implications
Long-term forest health monitoring has allowed us to detect subtle but steady changes in the condition of our forests. Long-term trends indicate that some species continue to fare better than others (e.g., increased dominance of American beech and red maple over sugar maple and birch species). Examination of metrics for other species indicates long-term trends that warrant ongoing monitoring of declining condition, particularly for paper birch and white ash. Regeneration data continues to indicate that the species currently dominating seedling classes may signal a shift in the composition of future forests in Vermont.
Forested ecosystems provide immeasurable benefits to society; from their aesthetic beauty and recreational opportunities, to biomass energy and carbon sequestration. While the composition of forests may change over time, ongoing work to monitor tree health and regeneration will inform forest management decisions to maximize forest resiliency, productivity, and health of Vermont’s forests.
Long-term trends continue to show declining tree crown health for white ash and paper birch, while others species continue to remain stable. Sugar maple regeneration is on the decline as red maple regeneration is inclining.
Acknowledgments: Special thanks to Josh Halman from the Vermont Forest Parks and Recreation Department for reviewing and editing the Forest Health Section of the 2017 FEMC Long-Term Monitoring Update.
Additional Resources
- VT Forests, Parks and Recreation Vermont Forest Health Highlights 2017. Online at https://fpr.vermont.gov/sites/fpr/files/Forest_and_Forestry/Forest_Health/Library/2017%20VT%20Forest%20Health%20Highlights.pdf
- VT Forest Insects and Disease Conditions 2017. Online at https://fpr.vermont.gov/sites/fpr/files/Forest_and_Forestry/Forest_Health/Library/2017%20Vermont%20Forest%20Insect%20and%20Disease%20Conditions%20Report%20FINAL%20updated.pdf
FEMC Project Database Link
- Forest health monitoring: https://www.uvm.edu/femc/data/archive/project/forest-health-monitoring