Ozone
Monitoring Ozone Pollution Levels and Foliar Injury in Northern and Southern Vermont
Ozone is a colorless, odorless gas that occurs naturally in the stratosphere, where it helps protect us from harmful ultraviolet radiation. Closer to ground level, ozone pollution is formed from photochemical reactions of nitrogen oxides and hydrocarbons, and causes a range of adverse effects on human health and sensitive vegetation. The US EPA sets and periodically revises national ambient air quality standards for ozone and other commonly occurring air pollutants, including "primary standards" to protect human health, and "secondary standards" to protect the environment. The current primary ozone standard is based on the highest 8-hour concentration in a day. The form of the standard is based on the 4th highest daily 8-hour concentration in a year, averaged over a 3-year period. The level of the current primary standard was recently changed to 70 parts per billion (ppb), and no secondary standard was set.
EPA's Clean Air Scientific Advisory Committee has recommended that the primary ozone standard be lowered to into the range of 60 to 70 ppb. The Advisory Committee also recommended that EPA set a separate secondary ozone standard to protect sensitive vegetation, based on cumulative exposure over the summer growing season. Because exposure to high concentrations are more damaging than low concentrations, a weighting function – called the W126 – is applied to the hourly ozone data before summing concentrations over the highest 3 months of the "summer" season (April through September). Because most ozone damage to plants occurs when plants are photosynthetically active, the W126 is typically limited to the "daylight" hours (nominally defined as 8 AM through 8 PM). The range of the summer, daytime w126 secondary ozone standard recommended by EPA's Science Advisors was between 7 and 15 parts per million-hours (ppm-hrs.).
The Data
The Vermont DEC Air Quality and Climate Division measures hourly ozone concentrations, year round, at long-term monitoring sites in Bennington (generally representative of southern Vermont) and at the VMC site in Underhill (generally representative of Northern Vermont). The most recent 2014 and 3-year average data, expressed as both the 4th highest daily 8-hour maximum and the 3-month daytime W126 index are summarized in Table 6 below.
2014 in Summary
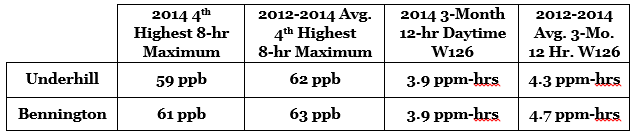
The 2014 ozone season was a relatively clean one in the northeastern US. The 4th highest 8-hour concentrations at the Underhill and Bennington, VT sites were 59 and 61 ppb respectively. The 3-year averages of these 8-hour maximum values were 62 ppb and 63 ppb – below the 70 ppb level of the current primary health standard, but within the 60 to 70 ppb range recommended by EPA's science advisors. The 2014 seasonal daylight w126 ozone levels were 3.9 ppm-hours at both VT sites, and the 3-year average w126 ozone values were 4.3 ppm-hours at Underhill and 4.7 ppm-hours at Bennington –well below the 7 to 15 ppm-hours range recommended by EPA's science advisors.
Long-Term Trends
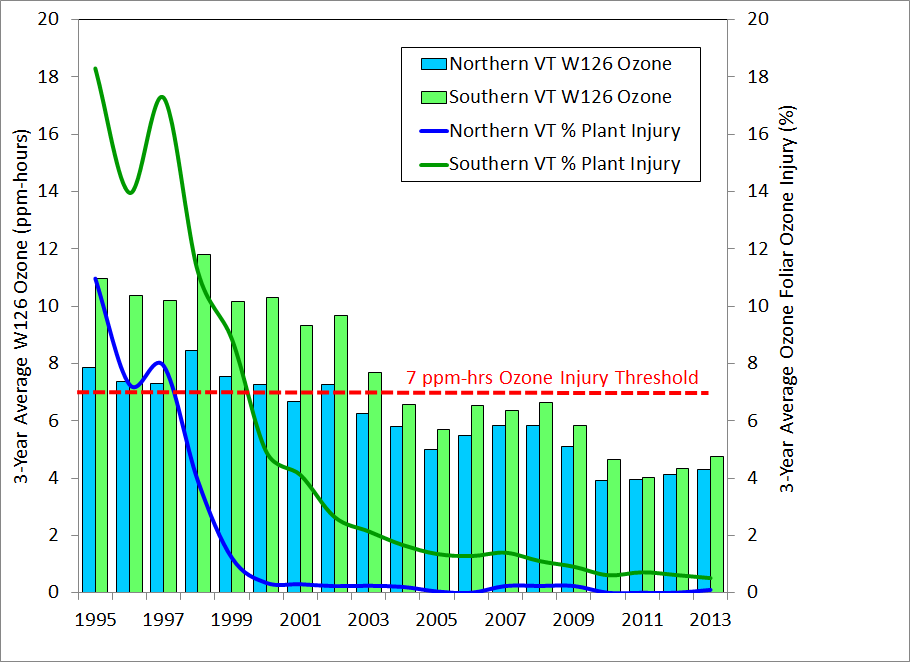
20-year trends in W126 ozone in northern (Underhill) and southern (Bennington) VT are plotted in Figure 18, as 3-year averages associated with the middle of each 3-year period. Also shown in Figure 18 are 3-year averages of percentages of observed ozone foliar injury symptoms on ozone sensitive plants aggregated across the Forest Service Forest Inventory and Analysis (FIA) plots in northern and southern VT. The FIA ozone foliar injury monitoring was terminated in 2010, but fortunately, the State of Vermont continued to collect this important parameter. It can be noted that declines of foliar injury have tracked the trends in W126 ozone levels, and that visible plant injury symptoms dropped to near zero as W126 concentrations dropped below about 7 ppm-hrs – the lower level of the range recommended by EPA's science advisors. Over the same 20-year period, peak 8-hour ozone has dropped from a range of 75-80 ppb to 65-60 ppb.
Implications
Substantial improvements have been observed in Vermont ozone concentrations over the past 20 years. These reductions reflect effective controls on emissions of hydrocarbons and nitrogen oxides from sources like power plants, and motor vehicles – both within Vermont and (more importantly) in upwind urban and industrial regions. Peak daily 8-hour concentrations - most relevant to human health effects – have declined from close to 80 ppb in the early 1990s to close to 60 ppb in the past few years. Vermont levels of the biologically-relevant summer seasonal W126 ozone index have experienced similar improvements, dropping from the range of 10 to 20 ppm-hrs in the early 1990s to 4 to 5 ppm-hrs in recent years. The frequency of visible foliar injury symptoms on ozone sensitive forest plants in Vermont has also declined during this 20-year period, with injury symptoms rarely observed over the past few years.
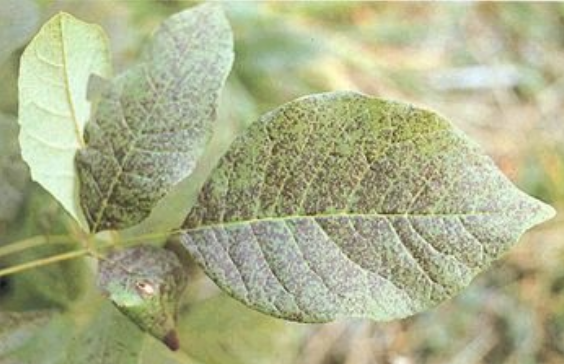
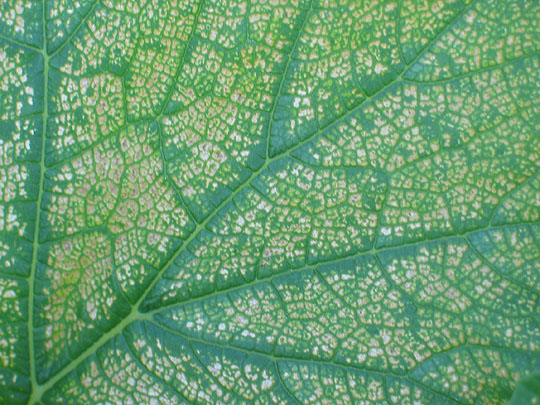
It should be noted that visible ozone injury symptoms are evidence of relatively extreme plant damage. Other effects - such as reduced photosynthesis, plant growth and carbon uptake, and increased susceptibility to disease and insect damage – can occur at ozone exposures lower than those which produce visible injury symptoms. In a similar way for both environmental and human health effects, no safe "threshold" concentration of ozone exposure has been identified below which no harmful effects are expected. So while the substantial progress achieved over the past few decades is good news for Vermont's citizens and our environment, we should work to continue this progress into the future, as current ground level ozone exposures remain well above natural conditions, and further reductions will yield further benefits to the health of Vermont's forest environment.
Vermont's ozone pollution has improved to levels where visible injury is rarely observed on our forest plants. However, plant health can still be affected at ozone exposures well below those which cause visible injury. Continued reductions are needed in the future.
Additional Resources
- Forest Inventory and Analysis Ozone Biomonitoring Program (active 1994-2010): http://www.nrs.fs.fed.us/fia/topics/ozone/
VMC Project Database Link
- Ambient Air Monitoring for Ozone: https://www.uvm.edu/femc/project/ambient-air-monitoring-for-ozone