Forest Health
Long-Term Canopy Condition and Regeneration Monitoring
Forest monitoring plots, such as those measured at the VMC network of sites, provide long term data on forest health trends and responses to disturbances. This includes detailed measurements of decline symptoms, which provide information on subtle changes in forest condition that may not be apparent from aerial detection or citizen reports of declining trees. Monitoring the nature and severity of stress responses is essential to understanding how best to manage forest resources into the future.
The Data
In 1990, a systematic forest health detection program started in New England and grew to become the national Forest Health Monitoring program, aimed at detecting emerging regionally significant forest health problems. We have adopted key ecosystem measurement methods from this program in our permanent forest health monitoring plots, including a full inventory of tree species, canopy characteristics, stress symptoms and damage agents. The VMC plot network provides a unique opportunity to co-locate these forest health measurements with those of atmospheric, weather, wildlife, water, and soils conditions at the Mt. Mansfield and Lye Brook Intensive Research sites. This allows us to examine relationships among environmental changes, forest health, and ecological dynamics. In addition, the VMC monitoring plots are located in forests most sensitive to anthropogenic stressors such as climate change and acid deposition, providing early indications of potential problems that will affect a wider area of Vermont's forests. In 2014, the full network of pre-existing VMC plots were measured in the same year for the first time since 2007, and two additional plots were added in key areas across the state of Vermont to ensure that the long-term monitoring network is representative of forests across the state . The 2014 field season included detailed canopy assessments of over 755 mature trees representing 16 different species.
2014 in Summary
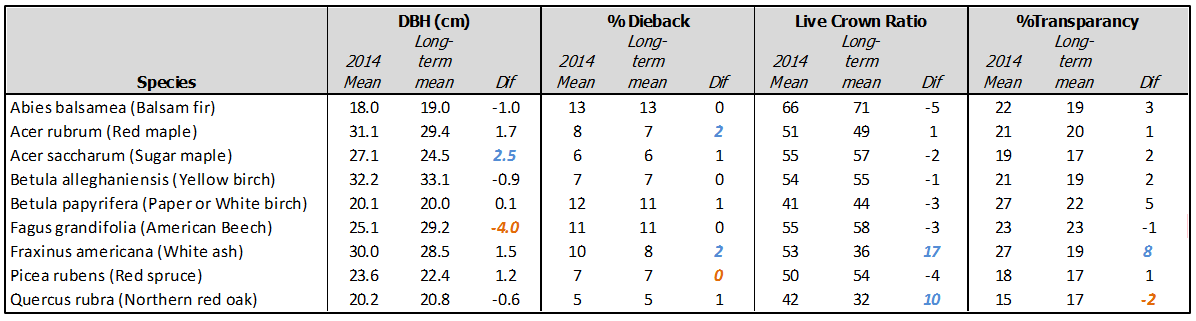
Forest Health: There are many metrics used to assess the condition of tree canopies. The VMC data follows FIA's Forest Health Monitoring (P3) methods for crown health assessments including early symptoms of tree stress such as increases in foliage transparency, as well as more chronic decline metrics such as crown dieback and live crown ratio. Our assessment of 2014 showed that percent dieback was on par with typical measurements for all species except red maple and white ash, which showed slight increases in average percent dieback (Table 1). Similarly, percent transparency increased significantly for white ash, consistent with the 2013 record high for this species. While there is concern that the invasive emerald ash borer may spread into Vermont, there was no evidence of infestation on VMC plots. Change in mean diameter at breast height (DBH) for many species likely results from natural successional processes. And the decrease in mean American beech DBH likely results from mortality of larger stems, combined with an increase in the number of saplings entering the inventory. Beech bark disease is frequently associated with beech decline at these sites.
While the mean dieback (9.6 percent) across all key species in 2014 was not severe, it does represent an increase compared to 2013 (9.1 percent dieback). Over the full historical record, 2014 ranked in the 79th percentile for all dieback measurements (up from the 54th percentile in 2013). This increase in dieback symptoms was particularly notable for American beech (from the 25th percentile in 2013 to the 54th percentile in 2014), red maple (from the 17th percentile in 2013 to the 88th percentile in 2014), and white ash (from the 25th percentile in 2013 to the 75th percentile in 2014).
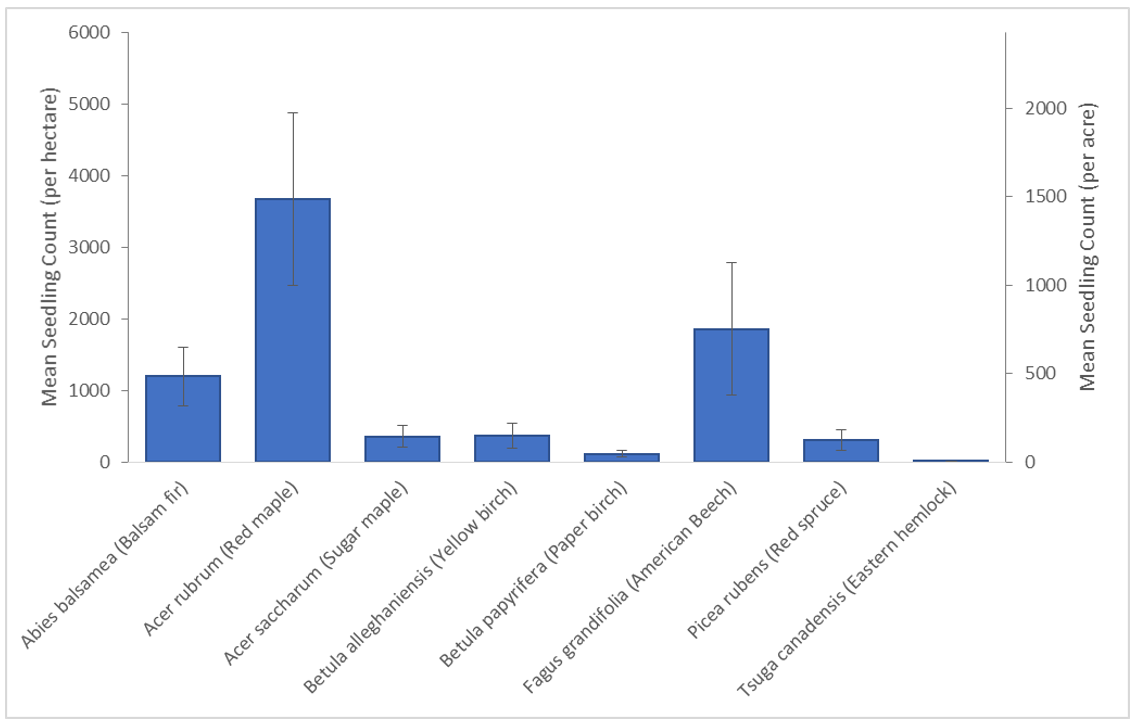
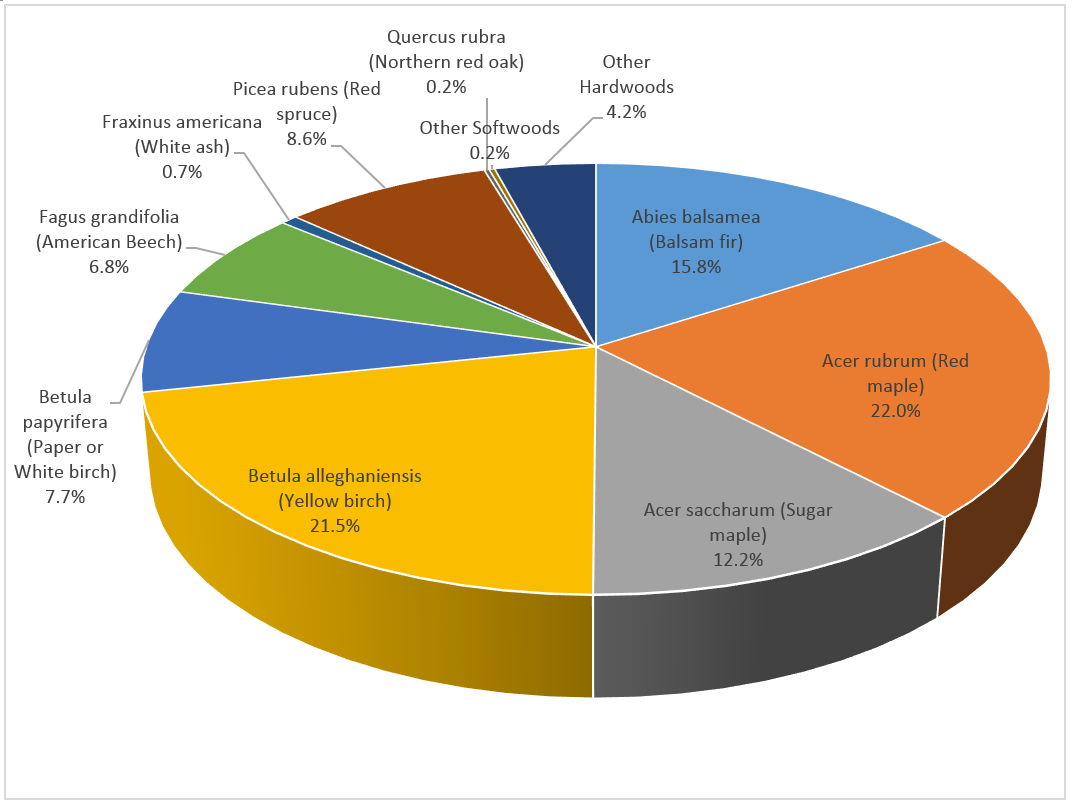
Regeneration: Similar to 2013, red maple regeneration dominated most plots, followed by American beech, and balsam fir (Figure 2). The high degree of variability across plots likely results from the broad geographic and elevational range of plots spanning several forest types. However, since most plots are located on mid-late successional stands the lack of regeneration of shade tolerant species such as sugar maple is concerning. Considering the species composition of mature trees across the VMC long-term monitoring plots (Figure 3) are dominated by red spruce and yellow birch at upper elevations, and sugar maple at mid- lower elevations, our data suggests that red maple and American beech are out-competing other regeneration. Considering the economic and ecological importance of sugar maple to the region continued monitoring of regeneration is warranted to understand the trends and patterns in sugar maple regeneration.
Long Term Trends
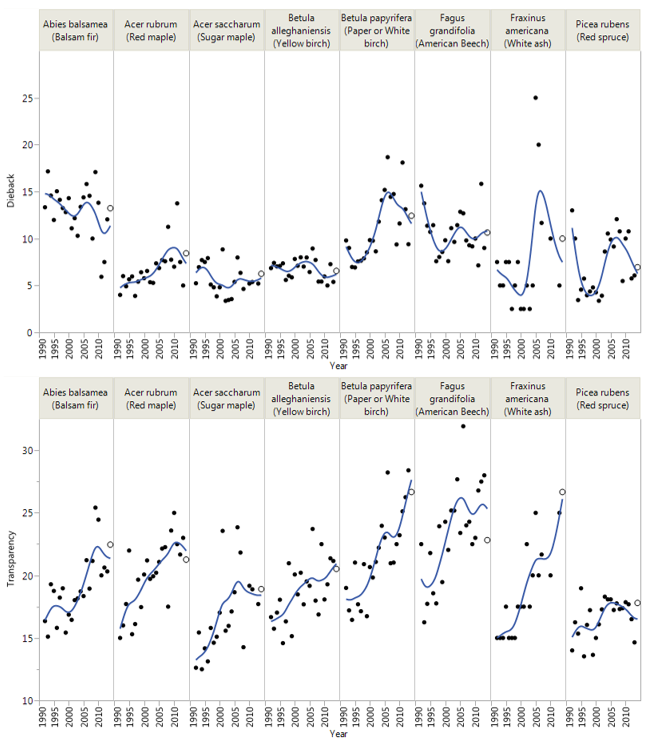
Forest Health: An examination of the full temporal data set allows us to look past the year to year variability to consider species recovery rates and identify more chronic stress conditions. Figure 4 fits a simple spline to the mean transparency and dieback for each species in each year. While there is clearly a large amount of year-to-year variability, the trends include a nearly uniform peak in percent canopy dieback in the late 2000's. Drought in 1999 and again in 2001-2002 were likely involved in these declines.
In contrast, mean transparency values over the past decade are nearly double the mean values in the 1990's for almost all species. This increasing trend may be reversing for most species except for yellow birch, white ash and paper birch. The VMC will continue to monitor these species to understand how changing environmental conditions are altering competitive relationships or altering productivity rates.
Regeneration: While regeneration data is available for the full VMC monitoring network in 2013 and 2014, assessments prior to that time were sporadic. Limiting our analysis only to plots located in the Browns River watershed on Mount Mansfield, (6 total plots measured five times since 1992) we find that 2014 was a boom year for regeneration across all species relative to previous levels (Figure 5). This is likely attributable to the relatively wet spring, when seedlings are most sensitive to drought-induced mortality. The predominance of red maple seedlings is particularly obvious in this watershed.
Implications
VMC forest health monitoring has been instrumental in determining how trees respond to and recover from stress events. Our monitoring is able to detect subtle but steady changes that may not be captured by VT FPR aerial surveys or highly visible to the public. Overall, 2014 canopy decline symptoms were slightly worse than in previous years. Species that appear to be experiencing continued decline trends include American beech, red maple, and white ash. Species currently dominating regeneration may be creating a different mix for the future forest.
Forested ecosystems provide immeasurable benefits to society; from their aesthetic beauty and recreational opportunities to biomass energy and carbon sequestration. While the composition of forests may change, this ongoing work will inform forest management decisions to maximize the productivity and health of the forested landscape into the future.
Canopy condition has varied over the past decade but the failure of these metrics to return to 1990 levels for many species indicates the need for continued monitoring and research into the drivers of forest productivity and health across the region.
Additional Resources
- VT Forests, Parks and Recreation Vermont Forest Health Highlights 2014. Online at http://fpr.vermont.gov/sites/fpr/files/Forest_and_Forestry/Forest_Health/Library/2014%20VT%20Forest%20Health%20Highlights.pdf
- Investigating Causes of Mortality in Vermont, IN Forest Health Monitoring: National Status, Trends and Analysis 2014. Online at http://www.srs.fs.usda.gov/pubs/49266
VMC Project Database Link
- Forest health monitoring: https://www.uvm.edu/femc/project/forest-health-monitoring